Wednesday, May 30, 2012

An A for Effort

I have had more than one conversation with my children about "how tough it used to be".  They are all college graduates now and I am not sure if they ever really believed the stories.

I did walk to school well over a mile every day in Michigan when I was in the sixth grade and was on the school's safety patrol.  It was cold and dark as I trudged across the frozen terrain in the winter.  I manned a crosswalk on a busy thoroughfare.  You would never see that today.

When my parents dropped my off for college everything I had was in one mid-sized trunk and a suitcase. My father helped me take my stuff up to my room, saw that I was the first to arrive and told me to grab the single bed and leave the bunk beds to my roomies.  Almost 4 years in the Army during World War II will teach you to look out for yourself first.  We dropped the bags, turned around and went downstairs to say goodbye to my mother.  Five minutes after we arrived they were on their way home.  By contrast, today's parents (me included) can't leave campus until every electronic device is hooked up, every book is purchased and every shirt folded away.

Neil Howe, the author of The Fourth Turning which I have written about before, captured the generational difference between the way Baby Boomers like me were raised and how Millennials like my children were raised in a recent commencement address at the University of Mary Washington.  Thanks to John Mauldin for providing the address in his Outside the Box blog.


You Millennials grew up in an era of rising parental protection, never knowing a time without bicycle helmets, electric plug covers, Amber Alerts, and fifteen different ways to be buckled into your minivan seat. We, the parents, grew up in an era of declining parental protection: Our moms and dads told us, "We don't care where you go so long as you're home for dinner." As for seatbelts, we were told if there's an accident to just throw up our hands to protect our heads. As kids, we never saw a "Baby on Board" sticker. "Baby Overboard" would have been more appropriate.
You Millennials were raised to be special—very special—and to trust your counselors, support groups, and smart drugs to keep you feeling pretty good about the world, like a Sims character having just the right digital balance. We, the parents, knew we weren't very special, didn't trust anyone to advise us, and thought staying away from counselors was a sign of toughness. When you came to college, there were long orientations and immersions, and many of your parents clutched teddy bears and wept. When we came to college, we jumped out of the car and tried to grab our suitcases before our parents sped off.


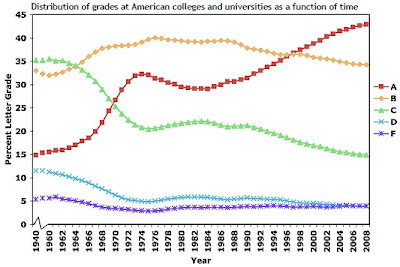
I also went to college when an "A" meant something.  It is far different today as Mark Perry points out in his Carpe Diem blog post "Today's Grade Inflated, Lake Wobegon World; Letter Grade of A Now Most Common College Grade".   It is nice to get this data and show my kids that it really was tougher when I was in school.  The only good thing about it is that my father did not have access to the same data to use it  on me.

This chart shows that the average GPA in US colleges has increased from a 2.5 when I started college to a 3.0 today.


More telling is the distribution of grades.  Since 1998, the letter grade "A" has become the most common grade that is given.  Almost 45% of all grades given in college are an "A".  Almost 35% of the grades are a "B".  What is supposed to be the average "C" is now only given out 15% of the time.


I am not going to get too worked up about the grades.  It is what the Millennials do when they get out of college is what really counts.  And we need to count on this generation to fix all that is broken right now.  Howe is optimistic that they may have what it takes.

So all of you parents out there: Be proud of this new generation. They aren't like you, but they are what America now needs. They don't complain about the storm clouds looming over their fiscal, economic, and geopolitical future; they try to stay positive. They don't want to bring the system down; they're doing what they can to make it work again. They worry about you a lot. And they want to come together and build something big and lasting, something that will win your praise. Beneath their tolerant, optimistic, networked, and risk-averse exterior lie attitudes and habits that may prove vital for our country's healing and for our country's future.
No one knows what challenges this Millennial Generation may eventually be asked to bear. Hardly anyone expects them to become America's next "Greatest Generation." But someday you can say you heard it from me: That is their destiny, to rescue this country from the mess to which we, the older generations, have contributed, perhaps a bit more than we ever intended—and, in so doing, to become a great generation indeed.
A good way for Millennials to start is to educate themselves about the issues, get to the polls in November and vote intelligently.  For the sake of their own future, this group cannot afford to be duped like they were in 2008 when they thought they were voting for hope and change.  They need to put the effort in to see that the road we are on right now is leading them over a cliff.


If they will put in this effort, they will get an A from me.

Monday, May 28, 2012

Cherokees, China and Choices

A Chrysler Jeep Cherokee SRT8 costs $189,750 in China.  This is over 3 times what it costs in the United States.  Why the difference?  China imposes import duties and taxes on the sale of the American-built SUV in their market. (Hat tip to BeeLine reader JWA for sending me this article).


We always hear all this talk about free trade but it often seems that it is a one-way street.  We provide a freeway into our market-the richest and most lucrative in the world-but we often see roadblocks are placed on our access to foreign markets.  How about free and fair trade?

In 2011, we imported $399.3 billion of goods from China.  We exported $103.9 billion to them.  A negative balance of almost $300 billion according to US Census Bureau foreign trade stats.

In 2001, we imported $102.3 billion and exported $19.2 billion for a negative balance of $83.1 billion.

Therefore, in the last decade imports and the trade imbalance with China have both grown almost 4-fold.

Why do we let China get away with it?  As of March 2012, China holds $1.2 trillion of federal debt.  It is the largest holder of our debt with the exception of the Federal Reserve which now holds $1.6 trillion of debt due to its quantatative easing (money printing) program. ( I am excluding debt held in intragovernmental funds like Social Security). You can see this massive growth in debt held by the Fed in this graph prepared by the Federal Reserve Bank of St. Louis.  In fact, as I have written before, the Federal Reserve bought 61% of all the federal debt issued last year to finance the deficit.


This is all the result of running massive federal deficits.  You need to get the money somewhere. China increased their holdings of our debt by about $900 billion over the last decade.  In effect, a lot of the money we shipped to them for the products we imported got loaned back to us.  However, they are not buying a lot of US Treasuries any more.  Of course, they are still selling us goods.  The game has changed but we are not doing anything about it.

Last year it was the Fed who printed the money and then loaned it to the federal government.

Both of the methods we have relied recently to finance our massive federal deficits are unsustainable.  We are in a precarious situation.   It is time to make choices.  Some of them will be very tough choices.

These are a few of the choices we need to make.

We need to reduce our federal deficit.  We need to reduce federal spending.  We need to reform the tax code.  We need to reform our entitlement programs.  We need to reform our public sector retirement programs. We need to rely less on moving money around on Wall Street and actually create wealth by producing something.  We need to take advantage of our natural resources by drilling for oil and gas and mining coal.   We need to reinvigorate our industrial base.  We need to make more things here and import less from China and elsewhere.   We need to export more things and insist that our trading partners play fair.

The most important choice is going to be who we send to Washington this November.  Unless that choice is correct, it appears it will be very difficult to get the other choices right.  If we don't get it right this time we might not have many choices left to us.

Sunday, May 27, 2012

Memorial Day

In memory of all those who have given the ultimate sacrifice so that we can live in freedom.

Let us never forget their memories.

Photos by Angela B. Pan.  I love her work.

Arlington National Cemetery


World War II Memorial and Washington Monument


Iwo Jima Memorial


Vietnam Memorial
American military deaths by war per Wikipedia.  This includes all deaths including those by illness, disease etc.  It is interesting to note that there were more American combat deaths on Iwo Jima in the 36 days it took to capture that island in WWII than all the military deaths in over 10 years so far on the War on Terror .  Almost 22,000 Japanese were killed in the assault on the island.


Civil War 625,000
WWII 405,399
WWI 116,516
Vietnam War 58,209
Korean War 36,516
Revolutionary War 25,000
War of 1812 20,000
Mexican-American War 13,283
War on Terror 6,280
Phillipine-American War 4,196


Our prayers are with every one of you for your service and the sacrifice you made for all of us.

Sunday, May 20, 2012

Facts and Beliefs

If only we could get everyone to read BeeLine.

A recent Rasmussen poll asked this question of likely U.S. voters.

"Over the past ten years, has government spending in America gone up, down, or stayed the same?"


Incredibly, only 76% of U.S. voters recognize that government spending has gone up over the last 10 years.  9% actually thought it had gone down and 9% thought it was about the same.  I guess the other 6% had absolutely not clue.

What was more interesting was that only 61% of Democrats answered the question correctly compared to 86% of Republicans!  I don't now if this means that Republicans are just better informed to begin with or they become Republicans because they know the facts.

Here are the facts.  The federal government increased spending $1.6 trillion over the last 10 years.  In constant dollars, adjusted for inflation, we spent almost $1 trillion more in 2011 than we did in 2002.  This is something that 39% of Democrats do not know?  No wonder we are in trouble!

Federal Spending 2002-2011
Dollar Amounts in Billions

Further evidence of the sorry state of political literacy is a news quiz that is available on the Pew Research Center website.

You can take the 13-question quiz yourself and see how you compare with 1,000 randomly selected adults who took the quiz.  It takes less than 5 minutes.  If you are going to do it, do it now without peeking as I am going to discuss the results below.

http://pewresearch.org/politicalquiz/

How did you do?

It looks like you can still rely on me to provide the shortest (and reliable) route to what you need to know as I answered all 13 questions correctly.  Only 8% of adults aced the quiz.

The full report and an analysis is here.  It is again a little scary.  For example, only 53% of adults know that Republicans are more supportive in reducing the size of the federal government and only 58% know that Democrats want to reduce defense spending.

Democrats again had less knowledge than Republicans on the issues and facts.  For example, only 46% of  Democrats know that it is the Republicans who are supportive of reducing the size of the federal government.  76% of Republicans got this question right.

Only 58% of Democrats know that Franklin Roosevelt was a Democrat versus 73% of Republicans who knew the correct party for the New Dealer.  On the other hand, 62% of Democrats know that Speaker John Boehner is Republican but 57% of Republicans don't know that he is.

Here is the breakdown of correct answers by Republicans and Democrats.  The only good news for the Democrats is that Independents are even less clueless about the political parties.  In some respects this is understandable but it is also troubling as these are the coveted "swing" voters. It raises questions about how they decide to "swing" with their votes from election to election.

The full survey had 17 questions compared to the 13 in the online survey.


I am a big believer in facts and data.  However, as we have seen above, many people don't have the slightest idea what the facts are.  Others are so attached to their beliefs (opinions) that they cannot believe the facts.  This is called the Semmelweis Reflex which I just read about in the book, Demand, by Adrian Slywotzky.

Ignaz Semmelweis was a doctor in the 1840's Vienna.  He was perplexed about a high incidence of infant deaths from puerperal fever.  He developed an innovative controlled experiment that showed that if doctors washed their hands with a disinfectant before interacting with patients there was a dramatic reduction in deaths.

However, this was before anyone knew anything about germs.  Even though the facts were staring the other physicians right in their faces it did not comport to their long-held beliefs.  It is human nature to reject new facts that contradict long-standing norms.  Facts and data will normally lose when put up against strongly held beliefs.   For many it is not "I will believe when I see it".  It is "I'll see it when I believe it".  No one would accept the findings of Semmelweis.  He died in an asylum at age 47 without convincing anyone.

I don't know of any other way to explain how 39% of Democrats do not know that federal spending has gone up over the last ten years.  Many undoubtedly choose not to believe it because in their minds the federal government never will do and spend enough.  There will always be a need for more spending on education, health care, the elderly, children, the poor, infrastructure, economic development, environmental protection, climate change etc, etc.

The real troubling fact is that these people have a vote just like you and I do.  As a result, it is going to take those with the belief that we need to take a different path to make sure they vote this November.


Thursday, May 17, 2012

A Million Dollars Or A Million Minds?

Would you agree to never use the internet for the rest of your life in return for $1 million?

This is a great question and I have asked it of a number of people.

I have not found anyone under the age of 30 who would give up the internet for the money.

You might find 80 year olds who would take the deal but I am sure it would still be a tough call for some.

It just shows how valuable and useful the internet has become in our lives.

In surfing across the world wide web yesterday I came across a couple reasons why it has so much value to us. It literally puts any information in the world at your fingertips.  It connects you with great minds, great thoughts and great ideas as never before.  It is as if you have millions of people at hand to call on for another perspective or to solve a problem.  It provides a platform to extend ourselves while the technology continues to extend itself.  We have seen Google, eBay, Amazon, Facebook, Twitter, Yammer, Instagram, Wayin and the list continues to grow.  The technology continues to expand and it extends our access to the world.

What were my big finds on the internet?

Have you ever wondered how common is your birthday?   Matt Stiles from The Daily Viz answers the question in this heatmap.


Not only is this information readily available at the New York Times but thanks to some cool technology from Tableau you can put together an interactive chart and create a data visualization to display it even more powerfully than what is shown above.  Tableau is a new name for me but I want to explore it some more as I love graphic renderings of data.  A picture truly is worth a 1,000 words or 10,000 columns of data!

A couple of observations on the data on birth dates.

  • September has the most birth dates.  September 16 is the most common birthday.  Look at the heavy number of births in September starting with September 8.  Of the top 16 birth dates,  fourteen of those dates are bunched between September 8 and September 25.
  • December 25 has the fewest birth dates (excluding February 29).  December 24 ranks #363 and December 26 ranks #363.  January 1 is #364.
  • Looking at these numbers you might think not much is going on 9 months before December. However, December 30 is #26, December 29 is #42 and December 28 is #62.  December 31 is #220.
  • January does not have any birth date higher than #260.  In fact, between January 1 and January 11 the rankings are (in order from 1/1)---#364, #362, #356, #350, #338, #301, #324, #347, #351, #349, #341.  Not a good time to be selling birthday cakes.
  • The week around Thanksgiving also has very few birth dates.  From November 22 to November 29 the highest ranking is #340.
  • The low number of birth dates around the Thanksgiving and Christmas holidays suggest that something besides nature is involved.  It would be interesting to look at the C-section rates right before these holidays.  C-sections make up about a third of all births. If it is Friday it is much higher than that suggesting a high number of "elective" C-sections for convenience.  The rate of C-sections is also much higher with male Ob-Gyns than with females.  In 1970, the C-section rate was about 5%.  Not only do C-sections cost more than regular deliveries but they also carry more risks for mother and child.  This is a trend that needs to be reversed.
  • The heaviest birth date months-July, August and September-are nine months after October, November and December proving that the onset of cold weather warms things up in other places.  
A million dollars to miss this kind of data and the charts that Tableau can do? Keep the money!

Tuesday, May 15, 2012

No Sense Even Though We Have No Cents

If you have a lot of money in your bank account you can choose to be stupid about your money and live another day.  If you have no cents in your pocket you better have a lot of common sense today.  Tomorrow is going to come and it is going to be even darker than today.

When I look at some of the things that the federal government is doing today it is apparent that common sense is nowhere to be found.  And when we are borrowing almost 40 cents out of every dollar we spend we need both sense and cents badly.

A few examples.

Last year I wrote about the obvious fraud that is occurring with regard to illegal immigrants taking advantage of the child tax credit.  In 2010 more than 2.3 million persons who did not have Social Security numbers valid for working in the United States received an average of $1,800 in child tax credits.  The refundable nature of this credit makes it ripe for fraud.  It would not be so bad if the Internal Revenue Service was doing anything to track down the tax cheats.  They do not appear to be doing anything about it even though they have the names and addresses of every person who claimed the credit on their tax returns.

Indianapolis TV station WTHR has picked up on the story that BeeLine wrote about last October.  You can view the report here.  You have to see it to believe it.  They even have interviews with the perpetrators.   In summary, we are borrowing and printing money to pay cash to people who are not even supposed to be in this country for children that are living in Mexico.  Where is the sense in this?

I have also written several times about the significant problems with the Social Security Disability program and Trust here and here.    We have an unprecedented numbers of people on the disability rolls and the Social Security Trust Fund is just four short years from insolvency.
We now have a ratio of workers on disability to active workers that is over 6%.  In the 1980's it was around 2%.  It is a little hard to believe that given all the advances in medical technology, ergonomics, workplace safety and greater accomodations for disability that are made by employers, that the disability rate could be 3 times higher today than 30 years ago.

Is this another case where lax and liberal government policies have disabled initiative?

These numbers are particularly troubling in light of the recent Social Security Trustees' Report.  That report projects that the Disability portion of the Social Security "Trust" Fund will be insolvent in 2016.  That is a mere four years away.  Under current law, an across the board benefit cut would be required that would cut benefits by an estimated 21% when the fund becomes insolvent.
You would think that with all of these issues there would be some interest in rooting out potential fraud in the program to insure that those that have serious needs would not have their benefits put at risk.  However, you would be wrong.  Consider this recent edict by the Social Security Administration that now prohibits administrative law judges from using the internet in deciding disability cases.  In effect, this means that an individual could have pictures plastered all over their Facebook page doing flips on a trampoline and it could not be used by the judge in deciding a disability case based on a back injury.
A decree by the Social Security Administration has put the internet off-limits for disability-claims judges when ruling on cases. And by internet, Social Security means The Internet – all of it, most notably websites where people tend to share personal information, like Facebook or Google+.  
You can read this more about the decision in WebProNews and in this article in The Washington Times.   Where is the sense in this?

A final example that shows the utter nonsense that we see in Washington and The White House is the testimony of a representative of the Government Accountability Office before a House subcommittee last week that places our fossil fuel resources ahead of any other country in the world.  More than Russia.  More than Saudi Arabia.

There is a lot of oil locked within oil shale formations in this country that could go a long way to satisfying our future oil needs.  In fact, the Green River Formation, that lies beneath parts of Colorado, Utah and Wyoming, alone contains an estimated 3 trillion barrels of oil and 1.5 trillion barrels of it is estimated to be recoverable based on available technology and current economics.  How much is that?  That is an amount equal to close to the entire world's present proven oil reserves!

This would normally be good news but we have a President and a number of Democrats who seem to have no interest at all in developing our natural resources.  They are more interested in spending billions of our tax dollars on so-called "green" projects like Solyndra while totally ignoring traditional energy resources that are proven and plentiful.  They have also refused to allow the Keystone XL Pipeline project that will not even allow us to benefit from oil produced in Canada.

Why is all of this troublesome?  Nearly three-quarters of the largely vacant lands that make up the Green River Formation is owned by the federal government.    Therefore, what we do with this opportunity is almost totally controlled by who is making the decisions in Washington.  It is there for the taking-a secure source of oil, energy to power our economy, jobs and something else we could use right now in Washington-MONEY.  Bruce Walker in The New American explains.


Because this oil is largely on federal lands, an enormous amount of federal revenue could be generated through lease options and royalty payments without raising tax rates at all.
How much? The standard royalty payment in the oil and gas business is “one-eighth of production free and clear of costs” or 12.5 percent of the value of the oil extracted. Assuming that the 3-trillion barrel figure is accurate and that the price of oil remains in the neighborhood of $100 per barrel, then the federal non-tax revenue from royalties alone could be as high as $37.5 trillion. However, that figure is no doubt an overestimate of revenue. As more oil is extracted, the price of oil will drop, and hence it will not be economically feasible to recover more of the oil at that point.
But even if only 30 percent of those royalty revenues flowed into the U.S. Treasury, that would be enough to pay off the entire national debt without raising tax rates or cutting federal spending. Moreover, state taxes on oil and gas produced would enable state governments to keep tax rates low without affecting government operations. 


Where is the sense in not doing everything to take advantage of this?

I think we should all be seriously concerned when we have solutions to problems right in front of us and we look the other way.  At times it seems that there is more interest in seeing us fail than in seeing us succeed.

Where is the sense in continuing with the "Hope and Change" agenda that gives us these examples of nonsense?


Thursday, May 10, 2012

Freedom in Berlin

I visited East Berlin in 1968.  The contrast between free West Germany and communist East Germany was stark.  It was sobering experience on the east side of the Berlin Wall.

East Berlin was in decay and depressing at every corner.  There was still a lot of war damage around the city even though World War II had ended over 20 years before.  The rubble had never been cleaned up.

The people of East Berlin were also in the dark.  They had no real understanding of what it was like in the West or in the United States.  I remember a member of our group telling our East German guide what the income of the average American was.  There was a look of disbelief and denial on her face.  That could not be true.  It had to be the propaganda she had been warned about from talking to Westerners. 

The big thing that struck me was that people with the same background, brains, heritage and innate humanity existed within yards of each other.  The only physical thing that separated them was a wall. However, the difference in individual, political and economic freedom was immense.  One group prospered. The other group was in the depths of poverty.

That experience left a profound impression on me.

Communist, collectivist and socialist economic models do not work. It did not work in East Germany.  It did not work in Russia.  It did not work in China. It is not working in North Korea or Cuba. 

Leftist politicians argue that they are champions of the poor.  They will equalize things.  They will insure bread for everyone and everything will be beautiful.  The only thing they end up doing is making everyone poorer.  That is the equality they bring. Everyone is the same except for the government bureaucrats.  They are the only ones who get rich.

My East Berlin experience came back to me today when I saw this photo gallery on Spiegel Online that compares photos taken by Photographer Stefan Koppelkamm in 1991 just after the Berlin Wall fell and what it looked like ten years later.

The only difference- ten years and FREEDOM.   It is amazing how much can be accomplished when the rights of people are put ahead of the rights of government.  Our Founders understood it well.  Why do we think there is a better way?

A courtyard on Markt Strasse in Erfurt, East Berlin, 1991


The same courtyard in 2003

No better example of people who think there is a better way are the Occupy Wall Street crowd.  If you want to see how a Wall Street occupier is literally "schooled" on the subject check out this video of a emigree of the USSR giving a young man a lesson in history, economics and world politics.  How many of the Occupiers know 1/100 of what this man knows about our country, our constitution and capitalism?  It is worth taking the 15 minutes to view the full video.  It is also worth a few moments for all of us to reflect on what we have after hearing from a man who has truly lived in a totalitarian, socialist world.

Tuesday, May 8, 2012

Trust and the "Trust"

The good news is that there has been a growth of 2.3 million jobs in non-farm payrolls since June, 2009.

The bad news is that there were 4.7 million new enrollees in the Social Security disability program during the same period.

John Merline in Investor's Business Daily recently did an excellent overview of how more and more discouraged workers are applying for and receiving disability benefits when their unemployment benefits end.


Credit:Investor's Business Daily


We now have a ratio of workers on disability to active workers that is over 6%.  In the 1980's it was around 2%.  It is a little hard to believe that given all the advances in medical technology, ergonomics, workplace safety and greater accomodations for disability that are made by employers, that the disability rate could be 3 times higher today than 30 years ago.

Is this another case where lax and liberal government policies have disabled initiative?

These numbers are particularly troubling in light of the recent Social Security Trustees' Report.  That report projects that the Disability portion of the Social Security "Trust" Fund will be insolvent in 2016.  That is a mere four years away.  Under current law, an across the board benefit cut would be required that would cut benefits by an estimated 21% when the fund becomes insolvent.

Many observers state that will never happen and that politicans will avert the impending crisis by simply reallocating money from the old age program to the disability program.  However, the Old Age "Trust" fund is also heading to insolvency in 2033 according to the Trustees' Report.  Attempting to raid the old age fund to pay for bills in the disability fund is like robbing Peter to pay Paul.  The only real answer is reform of both programs.

What would it take to put Social Security on a sound financial footing?

If we acted today, a permanent payroll tax increase of 1.11% on both employers and employees or a reduction in benefits of 13.8% would be required according to the Trustees' Report.  If we wait, the cost will get higher each year.

This should be a major topic in the upcoming election but we are unlikely to hear anything about it.  The impending Disability trust fund insolvency will show that the can has been kicked as far down the road as is possible.  We are at the end of the road.  The Disability program will need to be addressed in the next four years and it will likely mean that the Old Age fund will also be part of the discussion.

The easy answer is to just raise the taxes on the rich and be done with it.  The second easiest answer is to raise everybody's taxes.  However, it seems to me the first item in any reform proposal should be the obvious abuse in the disability system.  I have written about this before here and here

What I wrote about on the subject of abuses in the disability program last year still rings true today.
Our country has serious financial challenges.  There are many people in need. For our system to survive we have to make sure there is the utmost integrity in everything that government does.  Like so many of our social programs, the Social Security Disability Insurance Program is well-intentioned and well-meaning. However, it is not well managed.  It has to change.  Our whole approach to government programs has to change.  If it does not, many will lose all hope.  And that is something we really cannot afford to lose.
Beyond losing hope, there is also the question of losing trust.  Representative-based government rests on the important principle of consent of the governed.  In particular, the consent of those people who pay the taxes that pay the bills.  This consent is conditioned on government fairly and equitably governing if it is to be considered legitimate.  Government's role should not be to pick winners and losers. It should mete out justice equitably. It should make decisions based on the general welfare, not based on special interests.  It should protect minority and property rights.  It should not waste people's hard earned tax money.  No one wants to pay taxes.  When people think that there is total disregard for their money you have moved a step beyond that.  You endanger the entire foundation of trust government needs to govern.

It could not be stated better than it is in this quote.   
If the people cannot trust their government to do the job for which it exists - to protect them and to promote their common welfare - all else is lost.
                                                                                                   -Barack Obama

I don't agree with a whole lot that Barack Obama says.  This is one I agree with him on.  I just don't understand why he is running the goverment in a way that is undermining trust rather than promoting it.  

Monday, May 7, 2012

The Designated Pitcher

I loved yesterday's story in which Chris Davis, normally a first basemen and designated hitter with the Baltimore Orioles, was inserted as the pitcher in the last two innings of a 17-inning game with the Boston Red Sox.

The Orioles won the game 9-6 with Davis as the winning pitcher.


The Red Sox also had to go to a position player (Darnell McDonald) on the mound as Baltimore and Boston each used eight pitchers before running out of pitching arms.

It was the first time since 1925 in which both teams in a major league game had to put a position player on the mound.

In his two innings, Davis did not allow a run and stuck out two (including slugger Adrian Gonzalez on three pitches).

Davis did not do as well at the plate during the day.  He went 0-8 and stuck out five times as the designated hitter for the Orioles.  Fortunately, he was better as the designated pitcher yesterday.

Davis was the first position player to be the winning pitcher in a game since Rocky Colavito did it for the Yankees in 1968.  Sidenote-Colavito was one of my favorite players when I was a kid and he was playing for the Indians and the Tigers.


Sunday, May 6, 2012

Voting Your Pocketbook

The most recent federal government numbers indicate that there are 12.5 million unemployed workers in the United States.


This is almost double what the number of unemployed were in 2008.  The sad reality is that there are about 6 million more people unemployed today than there were four years ago.

There are also just short of 89 million working-age Americans not currently in the labor force.  These include students, stay-at-home parents, early retirees and those too discouraged to look for work.  They do not get counted in the workforce numbers that are used to calculate the unemployment number.  To show you how bad it is, the maximum reading on the chart prepared by the St. Louis Federal Reserve only goes to 88 million.


In the last four years, the numbers of Americans that are not in the workforce has increased by 9 million!  The number is up almost 6 million in the last two years.

Here are the actual seasonally adjusted numbers for April, 2011 and April, 2012 of those not working.  The number of those not working has actually increased by almost 2.7 million Americans while the unemployment situation is supposed to be improving.  Go figure.

April, 2011      85,726,000
April, 2012      88,419,000

To put this in perspective, about as many Americans have left the workforce since 2008 as we saw during the entire decades of the 1980's and 1990's combined according to this article.

When you put the all the numbers together, we now have over 100 million working-age Americans who are not working.  By contrast, there are about 141 million people working-75 million men and 66 million women.

This means that the labor participation rate (the number that are working compared to the assumed civilian labor force of people 16 years of age and over) has now dropped to 63.6.  This is the lowest percentage of people working since 1981.


However, in 1981, there were far fewer women in the workforce.  The labor force participation rate was at least five points lower then as more women did not work outside the home.

The labor force participation for men was the lowest ever recorded at 69.7 in April, 2012.  In 1981 it was 77.0.

I have written before that I am more concerned about the percentage of those employed than the percentage that are unemployed.  After all, there are bills to be paid in this country.  People need shelter, food, energy, medical care and other necessities.  The lower the percentage of those working, the greater the burden those working carry for everyone else.  It is a simple comparison of how many are in the wagon versus how many are pulling the wagon.

I think the answer to how all of this will play out in the 2012 elections is yet to be determined.  Under any historical perspective, we should be looking at a monumental repudiation of the status quo.  President Obama should not stand a chance of being re-elected when 100 million working-age Americans are not working.

However, these are not normal times.  In past years, a much higher percentage of these people would not be getting a ride in the wagon.   They would be looking for change and opportunity.  They would not be as dependent on the government.  That is why what should be a landslide election right now looks like it could go either way.

Look no further than the numbers below to see what I mean as to the numbers receiving various federal and state benefits.

Social Security beneficiaries                      44.7 million
Social Security disability                            10.6 million
Unemployment benefits                               6.6 million
Food Stamps                                              45.8 million
Federal civilian government employees          2.1 million


By the way, total uniformed military personnel is only around 700,000.  

It used to be that people voted their pocketbooks.  I don't think that has changed.  However, where is the pocketbook these days?                                  

Wednesday, May 2, 2012

Demography Is Destiny

I have always been intrigued by demographics.  It is a window to the future that is too often overlooked or ignored.  The long-term trends are often the most difficult to see in the 24 hour newscycle world we live in today.  In this day and age when there is so much focus on the trees (even the leaves at times!), demographics forces you to look at the forest. 

I wrote about demographics last year and highlighted a few interesting demographic trends.
The developed countries of the world are almost all experiencing birth dearth.  They are not coming close to the replacement birth rate.

All developed countries will have major budgetary challenges with their aging populations.

Immigration policy will also be major debate in all developed countries. 

Although the overall fertility rate is low in Europe, the Muslim birth rate in Europe is three times higher than the non-Muslim rate.  This will feed additional cultural and political divisions across Europe.

There are nearly 44 million Muslims in Europe today compared to 1.1 million Jews.  In the United States, there are 6.5 million Jews and 5.1 million Muslims.  There are actually more Jews in the United States than in Israel.  In fact, 88% of all Jews in the world live in the United States (46%) or Israel (42%).
Most of the high fertility rates in the world are in traditional Muslim countries.  This is not an encouraging statistic for the future considering much of the extreme elements of Islam are in the young age groups in these countries.

Although the overall average for the United States is 2.05, the Hispanic rate is 2.70, the Black rate is 1.93 and all others is 1.90.  Based on these birth rates and assuming current immigration trends, the current minority population will clearly overtake the non-Hispanic White alone majority over time.  A recent study projects this will occur within the next 30 to 40 years.  This is not much beyond a generation away since the average age of childbearing today is about 28 years old.
A recent Bloomberg article by Rammesh Ponuru provides some further interesting demographic insights and predictions.
Today’s most important population trend is falling birthrates. The world’s total fertility rate -- the number of children the average woman will bear over her lifetime -- has dropped to 2.6 today from 4.9 in 1960. Half of the people in the world live in countries where the fertility rate is below what demographers reckon is the replacement level of 2.1, and are thus in shrinking societies.
Ponuru makes some predictions for the future looking to the next 20 years based on these falling birthrates around the world.

The U.S.’s traditional allies in western Europe and Japan will have less weight in the world. Already the median age in western Europe is higher than that of the U.S.’s oldest state: Florida. That median age is rising 1.5 days every week. Japan had only 40 percent as many births in 2007 as it had in 1947.
These countries will have smaller workforces, lower savings rates and higher government debt as a result of their aging. They will probably lose dynamism, as well.

All these effects will, in turn, almost certainly make these countries even less willing than they already are to spend money on their armed forces. Americans who want Europe to bear more of the free world’s military burden -- or even provide for its own defense -- are probably going to be disappointed. So will those who expect Europe to take on humanitarian missions. It won’t even be able to maintain its current weight in future debates about the values of peace and democracy.
The demographic challenges of Europe and Japan have been well documented but China's emering demographic dilemma is not as well known. For example, did you know that China will have a higher percentage of elderly in 2030 than we have today in Florida?
China’s rise over the last generation has been stunning, but straight-line projections of its future power and influence ignore that its birthrate is 30 percent below the replacement rate.
The Census Bureau predicts that China’s population will peak in 2026, just 14 years from now. Its labor force will shrink, and its over-65 population will more than double over the next 20 years, from 115 million to 240 million. It will age very rapidly. Only Japan has aged faster -- and Japan had the great advantage of growing rich before it grew old. By 2030, China will have a slightly higher proportion of the population that is elderly than western Europe does today -- and western Europe, recall, has a higher median age than Florida
I continue to be concerned about the huge imbalance between males and females in China due to their one child policy combined with sex-selective abortions.  I am not sure any large society has ever had such an imbalance in favor of males in their 20's and 30's compared to females.  We have seen imbalances favoring females in the aftermaths of major wars.  For example, it is estimated that there were well over 20% less men than women in their 20's in the South in the aftermath of the Civil War.  In the Bavaria region of Germany it was estimated that in 1946 there were only 60 males for every 100 females aged 21-23.   We may have seen limited instances during the Gold Rush days in this country and other developmental periods where young males vastly outnumbered females but these periods were more limited in time and scope.  China is entering into uncharted demographic territory with the large scale of their population.
China, notoriously, has another demographic challenge. The normal sex ratio at birth is about 103 to 105 boys for every 100 girls. In China, as a result of the one-child policy and sex- selective abortion, that ratio has been 120 boys for every 100 girls. From 2000 to 2030, the percentage of men in their late 30s who have never been married is projected to quintuple.
I have heard the question asked as to what you do with an oversupply of 30 million testosterone-filled men in their 20's and 30's who have no chances to attract a mate?  The most obvious answer-put them in the Army.

Uh-oh.  That is not a good answer especially if the Chinese also hold a lot of our debt.  It is bad enough when you rely on someone else for your bread and butter.  When they also control a lot of guns and guys it is even worse.

19th Century French social scientist August Conte said that "Demography is destiny".  It is about time to we started paying attention.  Our destiny seems to be getting closer every day and we are not doing much about it.