Last week's GDP numbers came in at what looked like an impressive 3.3% annual rate for the fourth quarter, 2023 in the United States.
The mainstream media fell all over themselves trumpeting the news.
CNN called it "shockingly robust"
 |
| Source: https://www.cnn.com/2024/01/25/economy/fourth-quarter-gdp/index.html |
U.S. News and World Report referred to "boom" times.
The New York Times said that the U.S. economy "continues to defy expectations."
 |
| Source: https://www.nytimes.com/2024/01/25/briefing/us-economy-growth-north-korea-threats.html |
MSNBC reported that Biden-era economic growth exceeded all expectations.
 |
| Source: https://www.msnbc.com/rachel-maddow-show/maddowblog/biden-era-economic-growth-exceeds-expectations-yet-rcna135690 |
What I am having a difficult time understanding is that in light of these GDP numbers how is it that polling shows the American people have a very negative view about the condition of the economy?
Gallup's polling on economic confidence in December, 2023 showed that 45% believed the economic conditions in the U.S. were poor and another 33% believed that conditions were only fair.
Just 3% described economic conditions as excellent.
 |
| Source: https://news.gallup.com/poll/1609/consumer-views-economy.aspx |
Gallup's Economic Confidence Index is at one the lowest levels it has been in the last 30 years.
It has been in negative territory almost the entirety of the Biden administration.
 |
| Source: https://news.gallup.com/poll/1609/consumer-views-economy.aspx |
How can there be this large of a disconnect between what the government numbers say and what the American people believe?
This is of particular interest in this case because GDP (Gross Domestic Product) is supposed to be the best indicator of the health of a nation's economy and its prosperity in that it is the sum total of the value of all the goods and services produced during a specific period.
All of this is better understood in considering the basic formula for how GDP is calculated.
The best analysis and explantation as to why the GDP number looks good on paper, but it is not being felt by the American people, is the fact that private consumption (by individuals and private sector businesses) is lagging while government expenditures are exploding.
You can see this graphically in this chart by E.J Antoni that shows that in the GDP numbers Government Expenditures (the G in the formula above) has exceeded Personal Consumption Expenditures (the C in the formula above) in each of the last six quarters.
That is not the way it is supposed to work in a growing, healthy economy.
The bottom line is that the federal government increased federal debt by $834 billion in the fourth quarter but that only resulted in an overall total increase in GDP of $328 billion.
Put another way, there is a big difference when the private sector borrows and invests in plants, equipment and inventories that have an expected future return and when government borrows to mainly fulfill past political promises.
There is a lot of waste and leakage between the amounts borrowed and it becoming real added value in the economy.
And the federal government has been borrowing like no tomorrow since the debt ceiling limit was suspended in June,2023.
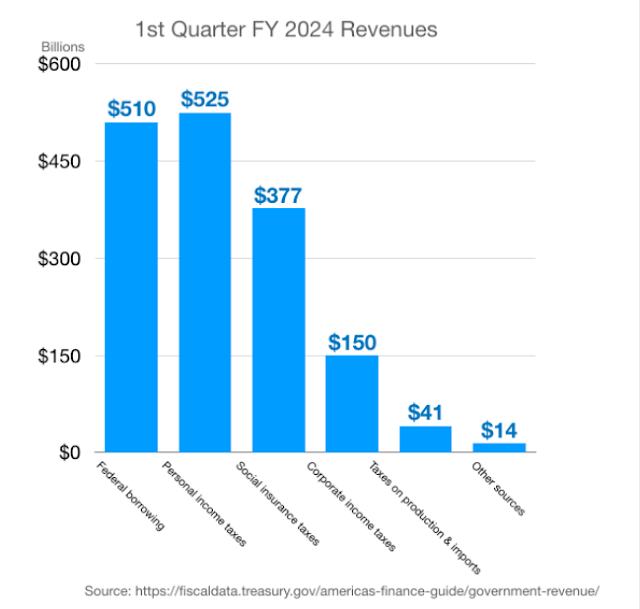
As I pointed out in an earlier blog post, borrowings have been the single largest revenue source for the federal government over the last six months.
You can see below how the $834 billion of federal borrowings in the 4th Q fiscal quarter dwarfed other revenue sources.
In just eight months since the federal debt ceiling was suspended, federal debt has increased almost $3 trillion.
 |
| Credit: https://twitter.com/RealEJAntoni/status/1750987793663135854 |
Each dollar of borrowing will also require more and more interest to be paid on that debt in the future that will be a further drag on economic activity.
Antoni believes that given the current trend in government spending, GDP, price indices and interest rates we could possibly see interest costs on the federal debt go from $1 trillion currently to $3 trillion by 2030.
Even if indexed for inflation, the $1 trillion could become $2 trillion. That is close to the what is currently collected in total individual income taxes per year.
It is hard not to conclude that all of this borrowing and government spending is just providing an illusion of prosperity in the GDP numbers.
Everyone in the mainstream media and the D.C. bureaucracy thinks everything is great.
It seems that only everyday Americans realize that something is seriously amiss.
Beware the illusion of prosperity.


No comments:
Post a Comment