Tuesday, February 28, 2012

The Middle and The Rich

There is a wealth of data in the IRS Statistics of Income Bulletin.  I recently looked at some of the information in the Fall, 2011 bulletin relating to the 2009 tax year.

I was particularly interested in looking at those taxpayers in the $50,000-$200,000 range in adjusted gross income.  There were 43.7 million returns filed for these income ranges in 2009.  You might call this "The Middle" as this probably represents a broad definition of what many would consider middle income taxpayers in the United States.  However, recognize that there were 93 million returns filed with incomes below $50,000 and about 4 million filed with incomes of $200,000 or above.

Consider these facts about "The Middle"(incomes between $50k-$200k).

  • $4.1 trillion out of total reported income of $7.7 trillion were to those in The Middle (53% of the total)
  • $3.1 trillion of $5.7 trillion in salaries and wages were earned by The Middle (54%)
  • $59 billion of $168 billion in interest income was earned by The Middle (35%)
  • $51 billion of $163 billion in dividends was earned by The Middle (31%)
  • $218 billion of $362 billion in capital gain distributions (principally from mutual fund investing) were earned by The Middle (60%)
  • $35 billion of $240 billion in long term capital gains came from The Middle (15%)
  • $484 billion of $823 billion of pensions and annuities came from The Middle (59%)
  • $677 billion out of $1.2 trillion in itemized deductions were from The Middle (56%)
  • $2.7 trillion out of $5.1 trillion in taxable income came from The Middle (53%)
  • $371 billion out of $866 billion in total income taxes were paid by The Middle (43%)
Consider these facts about "The Rich"( incomes over $200k)
  • $2.0 trillion out of total reported income of $7.7 trillion were to The Rich (26%)
  • $1.1 trillion of $5.7 trillion in salaries and wages were earned by The Rich (19%)
  • $64 billion of interest income of $168 billion in interest income was earned by The Rich (38%)
  • $86 billion of $163 billion in dividends were earned by The Rich (53%)
  • $41 billion of $363 billion in capital gain distributions were earned by The Rich (11%)
  • $185 billion of $240 billion in long term capital gains came from The Rich (77%)
  • $102 billion of $823 billion of pensions and annuities came from The Rich (12%)
  • $305 billion out of $1.2 trillion in itemized deductions were from The Rich (25%)
  • $1.6 trillion out of $5.1 trillion in taxable income came from The Rich (31%)
  • $434 billion out of $866 billion in total income taxes were paid by The Rich (50%).
A few observations.
  1. The Middle earns the bulk of the salaries and wages (54%), capital gains distributions (60%),  and pensions and annuities (59%).  They also claim more than half of the itemized deductions (56%). In fact, the amount of these deductions is also more than twice what The Rich claim (25%). 
  2. The Rich are rich not due to the their salaries and wages (they only account for 19% of the salaries compared to 54% for The Middle) but because of their investments.  53% of the dividends and 77% of the long term capital gains were earned by The Rich.
  3. The Middle had 53% of the taxable income but paid 43% of the total income taxes.  The Rich had 31% of the taxable income but paid 50% of all income taxes.  Despite what you may hear from time to time, this is a very progressive tax system.  Those below The Middle pay almost nothing in income taxes.  Those in The Middle are also big beneficiaries of the current tax system.
  4. The only way to raise any substantial amount of additional taxes on The Rich is to increase tax rates on dividends and capital gains.  However, you could tax both of these items at a 100% tax rate on the rich and you only would only reduce this year's projected budget deficit by less than 30%.
  5. The only way to raise significant amounts of income tax revenues is to increase tax rates on incomes in The Middle.  As you can see from the statistics above, this is where the bulk of the income earned in this country comes from and this is the group that benefits the most from the large numbers of deductions and credits.

Sunday, February 26, 2012

The Mighty Macs

I doubt many people have ever heard of Immaculata College.  Hint-It is located about 20 miles west of Philadelphia.  I would also suspect that few people know which team won the first women's national basketball championship.  Hint-It was held in 1972.

That first national championship was won by Immaculata College which had less than 500 female students.  They also went on to win the national championship in 1973 and 1974, played in the national finals in 1975 and 1976 and made it to the Final Four in 1977.  Their coach was Cathy Rush who quit college coaching after seven years at age 30 with a 149-15 record.

The story of Cathy Rush and Immaculata was recently made it into a movie, The Mighty Macs, that is now available on DVD.  It is a inspirational story that shows the power of hard work, heart, focus and faith.  Rush expected a lot out of her players and believed that they could be #1.  In fact, she passed out buttons early in her tenure to everyone with the inscription , "We will be #1".

Immaculata won the national championship in 1972 by beating a team (West Chester University) in the finals that had beaten them by 32 points just one week before in a regional tournament.  Cathy Rush was one great coach.

This is further evidenced by the success some of her players had as coaches in their own right after they left Immaculata.

  • Theresa Shank Grentz
    • Head coach at St. Joseph's, Rutgers and Illinois
  • Rene Muth Portland
    • Head coach at Penn State
  • Marianne Crawford Stanley
    • Head coach at Old Dominion (3 NCAA championships), Penn, USC and Cal-Berkeley

If you are looking for a nice G-rated movie with a message, you can't wrong with The Mighty Macs.


Tuesday, February 21, 2012

1% + 99% Should Be Greater Than 100%

We hear a lot about the 1% and fairness.  The chart below that was prepared by the Tax Foundation shows the share of income earned by the top 1% as well as the share of the income tax burden of the top 1%.  Progressivity is defined as the ratio of the top 1 percent's tax share divided by their income share.

A true fair share would have the tax share be the same as the income share.  A 2.00 ratio means that the tax share is double what the income share is.  Is that fair?  If not, what is?  2.50?  3.00?

What is interesting in the data is that the income tax system in 2009 placed a greater tax burden on the top 1% than at any time since 1986.  This is not something you hear in the press.  You also have to keep in mind that 1986 was the year in which there was the last big reform of the Internal Revenue Code.  Major changes were made in the definition of adjusted gross income which means that the data is not necessarily comparable for dates prior to 1986.

The other interesting perspective is how the share of the top 1% has changed over the years.  There is no question that a much greater share of income is concentrated in the top 1% today than it was 30 years ago.  You can see this trend beginning in the mid-1980's and continuing to the turn of the century.  It dropped for a few years and then picked up further momentum in 2004-2008 before dropping significantly in 2009.


Progressivity of the Federal Income Tax Code, Taking into Account Income Shares

YearTop 1% Income Share (A)Top 1% Tax Share (B)Progressivity (B/A)
19808.46%19.05%2.25
19818.30%17.58%2.12
19828.91%19.03%2.14
19839.29%20.32%2.19
19849.66%21.12%2.19
198510.03%21.81%2.17
198611.30%25.75%2.28
198712.32%24.81%2.01
198815.16%27.58%1.82
198914.19%25.24%1.78
199014.00%25.13%1.80
199112.99%24.82%1.91
199214.23%27.54%1.94
199313.79%29.01%2.10
199413.80%28.86%2.09
199514.60%30.26%2.07
199616.04%32.31%2.01
199717.38%33.17%1.91
199818.47%34.75%1.88
199919.51%36.18%1.85
200020.81%37.42%1.80
200117.53%33.89%1.93
200216.12%33.71%2.09
200316.77%34.27%2.04
200419.00%36.89%1.94
200521.20%39.38%1.86
200622.06%39.89%1.81
200722.83%40.41%1.77
200820.00%38.02%1.90
200916.93%36.73%2.17


What caused this?  I believe there were two big drivers.  First, the technology industry began to take off in the mid-1980's.  We entered the information age from a manufacturing age.  Manufacturing spreads income in a much broader swath in an economy.  You need to pay a lot of workers to build an automobile.  You only need a couple of computer programmers to develop a video game that might sell millions.  For example, the Call of Duty: Modern Warfare 3 game that was released last year grossed $1 billion in the first 16 days it was for sale.

The second factor was the bull market in stocks that began in the 1980's and reached its zenith in 2000 with the internet stock boom (technology again).  When stocks fell in 2001-2003 so did the incomes of the  1%.  Incomes rebounded with the stock market and with the housing bubble in 2004-2008 but 2009 showed again how connected the income of the top 1% is connected to a healthy stock market.

The popular narrative seems to be that we are playing a zero sum game when it comes to the economy.   That is, if the 1% has it then the 99% does not have it.  However, the data does not seem to back this up.  In fact, the numbers suggest that the unemployment rate has dropped as the share of the top 1% has grown.  Unemployment also has tended to increase as the share of the top 1% has dropped.

Unemployment Rate and Share of Income of Top 1%
1980-2009

For example, in 1983 the unemployment rate was 9.6% and the top 1% share was 9.29%.

By 1989 the top 1% had a 14.2% share of income but unemployment had dropped to 5.3%. 

Between 1989 and 1993 the top 1% income dropped to 13.8% and unemployment increased to 6.9%. 

Between 1993 and 2000 (the internet boom), the top 1% went from 13.8% to 20.8% and unemployment dropped from 6.9% to 4%. 

Incomes from the rich dropped from 2000-2003 to 16.8% and unemployment increased to 6%. 

The rich did well again from 2004 to 2008 and unemployment dropped. 

I don't think I need to go through the numbers from 2008 forward. The chart clearly shows the correlation between the loss of income with the top 1% and the loss of jobs overall.

This data should put to rest all of the class warfare nonsense the President and others want to participate in. The bottom line is that we are in this together in this country.  President Kennedy said it best 50 years ago when he said, "A rising tide raises all boats".   

We should spend more time and effort working to make the economic pie bigger rather than worrying about how to slice it.  The reality is that when the rich do better it seems that everyone does better.  If the rich become poorer, we all become poorer.  We need to start recognizing that if the 1% and 99% work together we will get much more than 100% in the end.  If it is the 99% versus the 1% we will get much less than 100% out of this country.

I don't remember a lot of class warfare talk back in 2000 when the share of the top 1% was 20.81%.  Of course, the unemployment rate was only 4% then.  Why do we hear so much about it now when the most recent data indicates that the top 1% have much less income and are paying even more taxes on that income than they did then?

Sunday, February 19, 2012

If You Are Content, You Have No Context

I am always looking for numbers that provide context to understand what is really going on.  Context is everything when assessing anything as I wrote last year.

Here is a good example of putting numbers in context courtesy of Charles Biderman of Trim Tabs.
Over the past year, take home pay for everyone who pays taxes is up something over $100 billion per year, or about 2% to 3% to $6.3 trillion and that $100 + billion gain does not even keep up with the current 3%+ inflation rate.
On the other hand US stocks are up over $3 trillion or 20% since the early October market low. That $3 trillion is an amount equal to all of the take home pay for all taxpayers over the past six months. Let me repeat that staggering number. The value of all stocks grew, which means an extra, $3 trillion since early October and the take home pay for everyone who pays taxes was about the same $3 trillion! Shareholders are racing ahead and getting rich and everyone else is sucking wind.
It does make you wonder where all the money is coming from.  Perhaps this is the answer.

Since October the Federal Reserve has printed about $600 billion of new money to pay the US government’s deficit. That is the only source of new money for the US economy. Does the Fed printing big bucks justify a $3 trillion increase in the market value of all US stocks? Not to me.
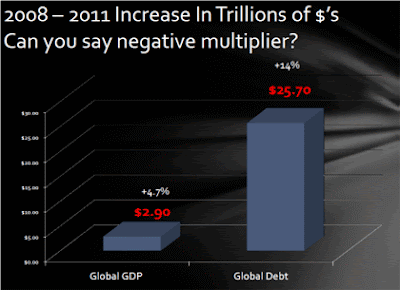
We keep hearing about the need for stimulus (translation-more borrowing and more debt).  How is that working?  Since 2008, global GDP has grown 4.7% or $2.9 trillion.  However, global debt has increased 14% or $25.7 trillion over that same period according to Money and Markets.  This means that almost 89% of this debt stimulus is no where to be found in an improved global economy.  How is it that this debt is going to be paid off in the future?

Source: Money and Markets
Debt can be helpful if it is used to improve productivity or efficiency.  It makes sense for the farmer to borrow to buy a tractor if he uses it to increase the crop acreage he can work.  More productivity should bring more profits and the increased profits can pay off the debt.  However, if you get nothing out of the purchase of the tractor in increased productivity or efficiency the debt will actually hurt the farmer much more than it will help.   The immense debt that has been taken on around the world portends even more trouble ahead unless global growth accelerates.  Right now, the debt stimulus is a large negative multiplier rather than a positive one.

Finally, a little context on Greece.  Last week saw violent protests in the streets in Athens. Greece was literally in flames as protestors objected to the need to cut another 150,000 public sector jobs over the next three years.  Let's put that in context.

Greece's population is 10.7 million.  The United States has a population of about 312 million.  Cutting 150,000 public sector jobs in Greece would be like eliminating 4.4 million public sector jobs in the United States.  There are about 2.3 million federal government civilian employees.  There are about 5 million state employees combined in all 50 states.   Therefore, if we would have to do something similar to what Greece is now faced with, we would have to eliminate over 50% of all federal and state government jobs.  And public sector employees in the United States are upset about losing collective bargaining involving their benefits?

We have not yet begun to see what is going to be necessary in this country to deal with our deficits.   If anyone is content with what is happening right now in this country, they have no context.


Thursday, February 16, 2012

2.2.22 Budget Plan

There is a lot of talk of deficits and debt with the recent release of President Obama's budget for 2012 thru 2022.  We consistently hear about the need for drastic spending cuts to remedy our fiscal woes.  However, how much do you think we would need to cut the federal budget from current levels to balance the budget if we set a goal to do so by 2022?  How much would we have to raise taxes?

The answer is that we do not have to cut anything.   We also do not have to raise taxes. We could balance the budget by 2022 if we just limited spending increases to 2.2% per year along with the current Internal Revenue Code.  When I tell people this simple solution they are almost always dumbfounded.  They hear about spending cuts but in the perverted world of government budgets a cut is not a reduction in spending from one year to the next.  It is merely a reduction in the level of spending increases.  There is no spending cut that you or I would recognize in our business or personal experience.

My plan is simply called the 2.2.22 Budget Plan based on the fact that limiting overall spending increases in the federal budget to 2.2% per year between now and 2022 will produce a balanced budget. It is also simple enough that even a politician with a 2.2 GPA should be able to grasp it.

The 2.2.22 Budget Plan assumes that federal revenues will increase by 6.0% per year.  This is right in line with the projected increase in revenues based on the most recent CBO report without taking account of any tax increases.  The revenue increases are projected to occur only through increased economic activity, inflation and other normal effects over the next ten years.

This graph shows how the deficit gap could be gradually reduced in a a reasonable manner following the 2.2.22 Plan.  Do you see any reduction in the red spending line below?

2.2-22 Budget Plan
Federal Revenues & Spending (2012-2022)
($Billions)

There are no drastic or draconian cuts despite what the demagogues would like you to believe.  Spending would  actually increase by almost $1 trillion over the next ten years under the plan.  Will the 2.2.22 Budget Plan require some tough decisions?   There is no disputing that.  We have put ourselves in a deep hole and it will require some real trade-offs and setting real priorities to fix it.  We are going to have to take a hard look at what is most important to us.  There will be some real pain.  However, any pain will be far less if we set reasonable targets now and commit to them than be forced into big cuts later when we might not be able to control the agenda as well.

Contrast the 2.2.22 Budget Plan with President Obama's Budget projections for the 2012-2022 period.

Obama Budget Plan
Federal Revenues & Spending (2012-2022)
($Billions)

This is just not a serious proposal.  The spending that is contemplated is simply not sustainable.   The Obama Plan also assumes $4.5 trillion in additional taxes over the ten year period but it still does not come close to balancing the budget.  Nothing could better demonstrate that we have first and foremost a spending problem that must be brought under control before we consider any further tax increases.

Keep these simple numbers and this simple phrase in mind.  Two. Two. Twenty Two.

Tell your friends.  Tell your neighbors. Tell your co-workers.  It is simple math.  2.2.22.