Wednesday, April 11, 2012

Instagram, Instabillion

You probably saw the news this week that Facebook has purchased Instagram for $1 billion in cash and stock.  Instagram is a free photo sharing program that allows users to take a photo, apply a digital filter to the photo (for example, to make it look retro) and then share it to different social networking sites.  It was founded a mere 18 months ago and has a mere 13 employees.

The principal founder, Kevin Systrom, is a 2006 Stanford grad who is 28 years old.  He will net a reported $400 million on the sale.


I thought this was an interesting story as it underscores several points that I made in earlier posts at BeeLine.

I wrote about the sad case of Eastman Kodak on January 2 of this year.  Kodak lost 88% of its stock value last year.  It was priced at 65 cents per share on December 31, 2011.  In 1997, it was trading at $95 per share.  I predicted that it would soon declare bankruptcy.  That prognostication proved accurate a couple of weeks later.

What I find interesting is that nobody knew more about photography than Kodak.  In fact, a Kodak engineer invented the first digital still camera.  However, it did little to capitalize on this expertise in the marketplace while other companies successfully undermined their film business with digital cameras.  To add insult to injury, a 20-something kid and 12 others develop a photo sharing program and net $1 billion while Kodak was on the road to bankruptcy.  What were they and all of their engineers doing?  It should be a cautionary tale to all of us.

The other interesting point in the Instagram story is the fact than so much money and wealth was created by so few.  We keep hearing about the uneven distribution of income and wealth in the world today compared to 30 years ago.  The Instagram story shows why this is occurring in the information age and the marked contrast with the manufacturing age of the past.  I wrote about this in BeeLine in 1% + 99% Should Be Greater Than 100%.
We entered the information age from a manufacturing age.  Manufacturing spreads income in a much broader swath in an economy.  You need to pay a lot of workers to build an automobile.  You only need a couple of computer programmers to develop a video game that might sell millions.  For example, the Call of Duty: Modern Warfare 3 game that was released last year grossed $1 billion in the first 16 days it was for sale. 
The Instagram story underscores the point.  In the manufacturing age you would need millions of invested capital in plant and equipment and thousands of workers to build a business worth $1 billion.  It is unlikely that it could be done in 18 months no matter what the resources were.  There is little doubt the world has changed.

This raises another question. How much should the federal government share in Mr. Systrom's good fortune?  This is a perfect example of a situation where President Obama's "Buffett Rule" would come into play.  This gain would be taxed at 15% based on current law.  The size of the gain is so large that it would dwarf any other income.  Thus, his overall effective rate is undoubtedly going to be close to that 15% rate.  President Obama's Buffett Rule would double the tax on Systrom and other entrepreneurs in similar situations to 30%.  Is that fair? You also need to keep in mind what happens to $60 million differential.  Based on past performance is that money going to be put to better use over the long term in the hands of Kevin Systrom or the federal government.  I leave that answer to you.


Sunday, April 8, 2012

Tax Blood and Rich Turnips

President Obama believes that if we tax the rich more that we can make everything right in America.

We hear a constant refrain that the rich do not pay their "fair share".

Of course, the facts directly contradict these statements.  As I have written before, the United States has the most progressive tax system in the world.  The rich pay a higher share of their income in taxes in the U.S. than in any other country that you can name.  More than Australia. More than Canada. More than France. More than Sweden. More than the United Kingdom.  More than any of the European welfare states.

What is true is that there is a much greater share of income concentrated in the top 1% than was the case 30 years ago.  This is an issue I also wrote about earlier this year in my post, 1% + 99% Should Be Greater Than 100%.  The share of income of the top 1% went from 8.30% of total income in 1981 to 16.93% in 2009.  This was matched by a similar increase in the tax share-17.58% paid by the top 1% in 1981 to 36.73% in 2009 proving that the taxes on the rich grew just as much (actually a little more) over the same period.  See chart.

Phil Gramm and Steve McMillin put it all together in an op-ed in The Wall Street Journal recently with a great analysis of the reasons behind the growth in income equality and why there are real limits to how much "tax blood can be extracted from rich turnips".

Gramm and McMillin list three dynamics that have resulted in the growth in income inequality.

First, is the fact that much more business income is now reported on individual tax returns in the form of partnership and subchapter-S corporations.  In 1986, just 5.6% of income for the top 1% was from these sources.  By 2007, almost 19% of the income declared on individual returns came from business income. Similar growth has also been seen in capital gains and dividend income.  As these marginal rates have been reduced, the amount of income reported on individual returns has grown significantly.

Second, the growing participation of China, India, Brazil and other emerging countries has affected incomes in the United States.
The vast expansion of labor engaged in world commerce has raised the return on capital and reduced the relative return on labor. The share of income flowing to capital—both traditional and human capital such as education and training—has risen. 
In relative terms, the return to unskilled labor has fallen. Short of a crippling reversal in world trade, which would reduce the value of both labor and capital, this effect will dominate world markets for the foreseeable future. Since high-income Americans own more capital and have higher levels of education and training, their incomes have grown faster than everyone else's.
Third, technological advances and increased economic freedom have affected income equality.  People like Bill Gates and Steve Jobs created fantastic new products that increased both productivity and our quality of life.  However, the information age spreads money around much differently than the manufacturing age we were in 30 years ago.  As I pointed out in my 1% + 99% blog article.
Manufacturing spreads income in a much broader swath in an economy.  You need to pay a lot of workers to build an automobile.  You only need a couple of computer programmers to develop a video game that might sell millions.  For example, the Call of Duty: Modern Warfare 3 game that was released last year grossed $1 billion in the first 16 days it was for sale. 
It is understandable that many see  all of this as "unfair".  However, who determines what is "fair" and "unfair"?  That is why it seems logical to look at other countries to determine the level of taxation that our "rich" pay compared to others to get some objective measure of "fairness".
While income distribution has become a source of protest and political debate, any analysis of taxes paid in high tax-and-spend countries shows that the U.S. has the most progressive income tax system in the world. An inconvenient truth for the advocates of higher taxes on America's rich is that big governments in developed countries are funded not by taxing the rich more than the U.S. does, but by taxing everybody else more.
Gramm and McMillin provide the numbers to back it up pointing out that if the United States taxed like France and Sweden it would hardly affect the rich.  The bottom 90% would see their taxes double.
In an eternal irony unique to large welfare states, it is the expansion of government in the name of the poor and middle class that always costs poor and middle-class families the most. When the U.S. collects 16.1% of GDP in income taxes, the top 10% of taxpayers pay 7.3% and the other 90% pick up 8.9%.
In France, however, they collect 24.3% of GDP in income taxes with the top 10% paying 6.8% and the rest paying a whopping 17.5% of GDP. Sweden collects its 28.5% of GDP through income taxes by tapping the top 10% for 7.6%, but the other 90% get hit for a back-breaking 20.9% of GDP. 
If the U.S. spent and taxed like France and Sweden, it would hardly affect the top 10%, who would pay about what they pay now, but the bottom 90% would see their taxes double. 
Since OECD members have significantly higher consumption taxes on average than the U.S., the total tax burden of bigger government is even more heavily borne by lower-income citizens in developed nations than these numbers suggest.
This is a big reason why I have so much trouble with President Obama's approach.  If he wants to model the United States on the European social model then he ought to be honest about it.  Put it out there and let the people decide.  We know they like the things that government can give them.  We need to find out whether they are willing to pay for them.

President Obama's health care reform package was the perfect opportunity for him to put it to the test.  It was easier to just send the bill to the rich and put in a mandate.  He clearly could have funded the program and got everyone to pay by putting in a broad-based tax (like Social Security or Medicare).  He never even tried.

At some point, all of this government spending either needs to be paid for or we need to drastically cut back.  Either way, it is the 99% or the 90%, not the 1% of 10%, who is going to feel the most pain.  As Gramm and McMillin point out, there is only so much tax blood that can be extracted from the rich tax turnips.


Thursday, April 5, 2012

Radical Ryan and Beyond Radical BeeLine

President Obama is in full attack mode.  One day he is taking on the Supreme Court.  The next day it is Paul Ryan and the House Republican budget.  

I thought that this video was particularly telling as it shows that the President's speechwriters have not even bothered to update the attacks on Ryan and the House budget since last year.   You would think that a year later that they could come up with some better talking points.  This shows that he is not only the "Teleprompter President" but he should be called the "Cut and Paste President" as well.


Keep in mind that President Obama is quick to criticize Ryan and the House Budget but the 2013 budget that he just submitted to Congress did not get one vote.  Not one Republican or Democrat voted for the Obama budget!  The final count was ZERO votes for Obama's 2013 budget plan and 414 votes AGAINST the White House plan.

This is a chart that comes directly from the Obama's 2013 Budget submission that shows the trajectory of publicly held debt under his proposal extended to the out years.


Is it any wonder he could not get even one Democrat to vote with him?

How radical is the Ryan House Budget?   After all, President Obama has described it as "a Trojan horse" that seeks to impose a radical vision" on the United States.  He called it "nothing but thinly veiled Social Darwinism" and "antithetical to our entire history as a land of opportunity and upward ability for everyone who's willing to work for it".

Hearing him speak you would think that the Ryan budget is cutting the social safety net and federal government spending with a meat cleaver.  What happens to federal spending between 2012 and 2022 under Ryan's plan?

Let's start with overall spending.

2012 Federal Outlays  $3.6 trillion
2022 Federal Outlays  $4.9 trillion
Average Annual Increase in Federal Spending +3.1%
Total Increase 2012-2022  +36.1%

What about Social Security?

2012 Federal Outlays $770 billion
2022 Federal Outlays $1.34 trillion
Average Annual Increase in Spending on Social Security +5.7%
Total Increase 2012-2022  +74.0%

What about Medicare?

2012 Federal Outlays $560 billion
2022 Federal Outlays $855 billion
Average Annual Increase in Medicare Spending +4.3%
Total Increase 2012-2022  +52.7%

What about Medicaid and Other Health Spending?

2012 Federal Outlays $287 billion
2022 Federal Outlays $402 billion
Average Annual Increase in Medicaid and Other Health Spending +3.4%
Total Increase 2012-2022  +40.1%

What about Discretionary Spending? (this includes Defense spending and most other government operational spending)

2012 Federal Outlays $1.300 trillion
2022 Federal Outlays $1.212 trillion
Average Annual Increase (Decrease) in Discretionary Spending -.7%
Total Decrease 2012-2022  -6.8%

Does this look anything like a radical plan?  It proposes overall spending restraint of slightly more than 3% per year.  That is restraint, not cuts.  The only area that real cuts are occurring (as a normal person would define it) are in the area of discretionary spending.  Bear in mind that about 2/3 of "discretionary spending" is for Defense.  

The Ryan budget actually does not balance the federal budget until 2035! Truly radical!

I proposed my 2.2.22 budget plan in an earlier post this year.  This plan simply states that we can balance the federal budget by 2022 if we constrain overall federal spending to no more than an annual 2.2% increase for the next 10 years.  This also assumes no changes in tax law using current tax revenue projections of the Congressional Budget Office.

Most people I talk to believe that providing the federal government with an additional 2.2% per year seems very reasonable.  This is particularly true when so many families are not getting close to that number in additional income increases in this economy.  If Ryan is radical then BeeLine must be beyond radical.  And I thought I was just being reasonable! 


Tuesday, April 3, 2012

Interest Insomnia

If there is anything that should keep you awake at night it is the ravenous need of the federal government to finance its deficit spending.

Another $1 trillion of debt must be issued this year to fund the current year's spending needs in excess of revenues.  In addition, almost $6 trillion of the federal government's debt held by the public must be refinanced in the next five years.  As of April 2, there is almost $11 trillion of debt owed to the public (that includes individuals, institutions (mutual funds, insurance companies etc) and foreign governments (China, Japan etc).  Another $4.7 trillion is composed of intragovernmental obligations to Social Security and other government entities.

This means that over the next five years the federal government will have to find a way to sell in excess of $10 trillion of debt obligations to the public. 

The current average interest rate on all federal debt right now is just 2.2%.  

Let's put that in perspective.

In fiscal 2011, the U.S. had net interest expense of $230 billion on its federal debt outstanding of almost $15 trillion.  In 1997, when federal debt was less than $5 trillion, net interest costs were $232 billion.  Therefore, despite the fact that fedeal debt has increased over 3-fold in the last 15 years, the federal government paid less in interest costs in 2011than it did in 1997 due to these extraordinarily low borrowing costs.

An increase in average interest rates to the level of 1997 (around 5.8%) would add almost $500 billion in additional interest costs to the federal budget!   To be fair, some of this would inure to the benefit of the Social Security Trust Fund and other intragovernmental funds.  However, the net cost is almost $90 billion for each 1% increase in net interest costs.

Let's put that number in perspective.

In 2011, the federal government collected just slightly over $1 trillion in indvidual income taxes.  Therefore, a $500 billion increase in the federal budget to fund increased interest costs on the federal debt would require a 50% across the board increase in income taxes.  Alternatively, if these costs had to covered by reducing spending, it would require the elimination of all Medicare spending ($555 billion in 2012) or all Discretionary Spending ($528 billion in 2012).

Why haven't we seen interest rates already start to increase?   First, Europe's problems have been receiving all of the attention so we have not had to deal with the heavy glare of the world's capital markets while the Euro debt crisis melodrama plays out.  Second, the Federal Reserve is buying up almost all of the debt by printing money.  In 2011, the Fed purchased 61% of all federal debt.  This is simply not sustainable.  Even worse, this level of debt purchased is masking the reduced demand for our debt and is also delaying the inevitable day of reckoning.  We have been getting a free ride but the day is coming where we are going to be charged the full fare (and more).

Caroline Baum, a columnist for Bloomberg News, summarizes the issue very nicely in "Four Numbers Add Up to a American Debt Disaster".

She sees a major problem with the short duration of the Treasury debt.  In fact, only 10 percent of federal debt matures beyond a decade from now.

The U.S. is more dependent on short- term funding than many of Europe’s highly indebted countries, including Greece, Spain and Portugal, according to Lawrence Goodman, president of the Center for Financial Stability, a non- partisan New York think tank focusing on financial markets.
The U.S. may have had a lot more debt in relation to the size of its economy following World War II, but the structure was much more favorable, with 41 percent maturing in less than five years, 31 percent in five-to-10 years and 21 percent in 10 years or more, according to CFS data. Today, only 10 percent of the public debt matures outside of a decade.
We hear some liberal economists argue that the current ability to borrow so much at 2 percent interest rates means that we should be doing even more stimulus spending.  However, the funny thing about the access to credit is that it can literally dry up in the blink of an eye.  There is nothing more dangerous than borrowing short term while using the money for long term commitments.  This is exactly how we are financing the federal government right now.  Baum says it succinctly.

So the next time you hear someone say the Treasury can borrow all it wants at 2 percent, tell him, that’s true -- until it can’t.
We would also be wise to consider some thoughts on debt by our first President.

"There is no practice more dangerous than that of borrowing money; for when money can be had in this way,' repayment is seldom thought of in time, the interest becomes a moth, exertions to raise it by dent of industry ceases, it comes easy and is spent freely, and many things [are] indulged in that would never be thought of if [they were] to be purchased by the sweat of the brow.... in the mean time the debt is accumulating like a snow ball in rolling."
-George Washington in a letter to his nephew, Samuel Washington, Mount Vernon, 12 July, 1797

"To contract new debts is not the way to pay old ones."
-George Washington in a letter to James Welch, Apr. 7, 1799

Thanks, George.  However, thinking about the interest costs that are building on our national debt should cause all of us a lot of insomnia.

Monday, April 2, 2012

Is It About Supply and Demand?

The U.S. Energy Information Administration released data today on total gasoline sales in January by refiners.  Sales (consumption of gasoline) continued to fall with January seeing only 28.4 million gallons/day going from refiners to gas and filling stations.  Gasoline sales are less than half of what they were 4.5 years ago (60.9 million gallons/day in July, 2007) and almost 30% below the levels of a year ago (40.3 million gallons/day last year).

I wrote about this stunning statistic last week and the possible reasons for this drastic drop.  The higher gas prices that we are all experiencing does not seem to be the total reason for the longer term trend.  The chart below shows the decline in gasoline sales since July, 2007.

Total U.S Gasoline Sales by Refiners (Millions/Gallons per Day)
Source:U.S. Energy Information Administration

A further question to ponder is if demand has dropped this dramatically since last year, how can prices continue to be climbing?  Is demand in the developing world (China, India etc) making our drop in consumption irrelevant?  Is it the uncertainty in Iran and the Middle East? Is it the speculators?  Is it the declining price of the dollar vs. gold?  Is it all of the above?

Whatever it is, it is hurting Americans in the pocketbook.  It is also another reminder of why we should be doing everything we can to take advantage of our domestic energy resources.  We need all of them-oil, gas, coal, hydro, nuclear and alternative sources.  Our economy does not go-or grow-without accessible and affordable energy.

Thursday, March 29, 2012

Stunning Gas Stat

We all know that gasoline prices are on an upward climb.

I came across this stunning stat recently that shows that gasoline consumption in the U.S. is falling like a rock.  More like going off of a cliff.  This chart was prepared by Steven Hayward of the American Enterprise Institute from data collected by the U.S. Energy Information Administration that tracks retail deliveries of gasoline to filling stations.  Since this is what is being delivered to gas stations it represents what is being sold and consumed by the cars and trucks which travel our roadways.

Monthly U.S. Total Gasoline Retail Deliveries By Refiners

(Note-this chart does not include a data point for December's 30.4 million gallons/day. The EIA released this data earlier this month after Hayward published this chart.  January's number will be availalble in early April).

From the mid-1980's until mid-2007 gasoline retail deliveries stayed pretty much in a range of approximately 60 million gallons per day (+ or - 10%).  In fact, from May, 1983 to June, 2009 there was not one month that gasoline deliveries were less than 50 million gallons per day.  See the stats for each month at the EIA website.  

Since July, 2009 there has not been one month where deliveries were more than 50 million gallons per day.  For the first nine months of 2011 deliveries dropped to around 40 million gallons per day. However, in the last quarter of 2011, deliveries were averaging only 31 million gallons per day.   In other words, in the last few months we have only been consuming about half of the gasoline we have been for most of the last 25 years!

The big question is what is going on?

Has this significant decrease been caused by rising gasoline prices that has caused people to drastically cut back on their driving?  That must have some effect but we were still using 50 million gallons per day almost a year after the price shock that took prices over $4 per gallon in mid-2008. However, consumption continued dropping even though gas prices were falling in late 2008 and 2009. Prices dropped from $4.17/gallon in July, 2008 and were at $2.676 in December, 2009.  During the same time retail sales of gasoline fell from 49.7 million gallons per day to 47.4 million.  See EIA stats.

Has this been caused by increasing fuel efficiency in the fleet of cars and trucks on the road?  This
also must be having some effect but the average vehicle in America has not suddenly starting getting double the miles per gallon over the last few years.  We are not selling tha many Chevy Volts!  Only 7,671 were sold in 2011.

Has this been caused by the emerging virtual economy with more people working and shopping from home? There are clearly more people telecommuting and shopping over the internet.  However, it is unlikely this alone could have the dramatic effect we are seeing in this gasoline sales data.

Has this been caused by the poor economy and increased unemployment?  There has been an historical correlation between reduced GDP and lower gasoline usage.  You can see it above in the lower levels of gasoline usage in the early 1980's and 1990's recession and the period right after 9/11.  The same is true for the reverse.  The boom years of the late 1980's, the late 1990's and the mid-2000's recovery all caused retail gasoline sales to spike.  The correlation does not seem to be as strong with employment.

Charles Hugh Smith looks at all of the possibilities in his blog article "Why Is Gasoline Consumption Tanking?  He has significant concerns about what this could mean for the economy over the next few months.
That 27% drop in a few months in unprecedented, except in times of war or sharp economic contraction, i.e. recession.
If we stipulate that vehicles and fuel consumption are essential proxies for the U.S. economy, then we can expect a steep decline in economic activity to register in other metrics within the next few months.
Such a sharp drop would of course be "unexpected" given the positive employment data of the past few months. But as the data above shows, employment isn't tightly correlated to gasoline consumption: gasoline consumption reflects recession and growth.
In other words, look out below.

I must admit I don't know what is going on. What I do know is if you would have made a statement in June, 2007 (when daily retail sales were 60.9 million gallons) that by the end of 2011 we would be using only half that much gasoline in our cars and trucks there is not one person who would have believed you. This would not have even been considered realistic as a Tom Clancy plot line in one of his novels.

This is one stat we will need to keep our eye on.

Tuesday, March 27, 2012

Time to Take a Stand

The numbers are so large when it comes to the federal budget deficit it is hard for them to seem real.

In the 2011 fiscal year, the federal budget deficit was $1.3 trillion.  That is 1,300 billion dollars!

There are about 117 million households in the United States.  An average of $31,000 was spent for every household in America by the federal government in 2011. The tax burden is about $20,000 per household on average.  That means that over $11,000 of federal debt was taken on in 2011 for every household in America.

If this was a family with $100,000 of income, they spent $155,000 and put $55,000 on their credit card. They would be carrying total debt of $660,000 on their $100,000 of annual income.

Where does the $31,000 in spending go ? About $10,000 goes to Social Security and Medicare.  Paying for welfare, disability income, food stamps, unemployment benefits and federal retirements costs over $5,000 per household.  Defense is $6,000 and Medicaid and other health services are around $3,000. Federal support for education is about $1,000 and interest on the federal debt is $2,000.  These categories total $27,000.  Everything else (government operations, national parks, post office, criminal justice, veteran's benefits) is a mere $4,000.

Mark Steyn writing for the National Review adds additional perspective.

  • The federal deficit in 2011 was approximately equal to the entire economy of Russia, Canada or India.  Simply stated, to merely finance our debt we would need to take almost the entire economic output of these countries just to pay for our deficit spending.   (Estimated GDP in 2011-Canada ($1.574 trillion), India (($1.538 trillion), Russia, ($1.465 trillion).
  • Congressman Paul Ryan and the Republican Budget Plan has been consistently castigated by the Democrats and President Obama for its supposed austerity.   However, the alleged enemy of seniors, widows and orphans does not propose to balance the budget until 2040- a mere 27 years from now!
  • The news lately has been focused on the debt problems of Greece.  Our national debt as a percent of GDP is still a little short of the numbers in Athens.  However, when Morgan Stanley added in the state and municipal debts and public pension obligations of both countries in 2009, Greece was at 312% of GDP and the United States was at 358%.  These numbers do not include the unfunded liabilities of Social Security and Medicare.
Steyn posits on where and how does it all end?
“We are headed for the most predictable economic crisis in history,” says Paul Ryan. And he’s right. But precisely because it’s so predictable the political class has already discounted it. Which is why a plan for pie now and spinach later, maybe even two decades later, is the only real menu on the table. There’s a famous exchange in Hemingway’s The Sun Also Rises. Someone asks Mike Campbell, “How did you go bankrupt?” “Two ways,” he replies. “Gradually, then suddenly.” We’ve been going through the gradual phase so long, we’re kinda used to it. But it’s coming to an end, and what happens next will be the second way: sudden, and very bad.
By the way, that decline in the U.S./Australian exchange isn’t the only one ($1.00 now buys only .95). Ten years ago the U.S. dollar was worth 1.6 Canadian; now it’s at par. A decade ago, the dollar was worth over ten Swedish Kroner, now 6.7; 1.8 Singapore dollars, now 1.2. I get asked with distressing frequency by Americans where I would recommend fleeing to. The reality is, given the dollar’s decline over the last decade, that most Americans can no longer afford to flee to any place worth fleeing to. What’s left is the non-flee option: taking a stand here, stopping the spendaholism, closing federal agencies, privatizing departments, block-granting to the states — not in 2040, but now. “Suddenly” is about to show up.
Another reality is that I have found no one that can answer this simple question.  And I talk to a lot of very well-informed people.

"How much would we have to constrain or reduce spending per year over the next 10 years from what we are spending today in order to balance the federal budget by 2022? 


The answer is that we do not have to reduce it at all.  This is a shock to everyone I speak to. All they hear in the media are about cuts, cuts, cuts.  However, if you read BeeLine you know the answer is that we can actually balance the budget in ten years if we increase spending by no more than 2.2% annually between now and 2022.  We do not have to cut anything compared to what we are spending on federal programs today as you and I would define that term.  This assumes no tax increases and continuation of current tax law. See the 2.2.22 Budget Plan. 

Would it be easy to do?  By no means.  Social Security and Medicare are projected to increase by well more than 2.2% per year with Baby Boomers entering retirement.  Interest needs to be paid on the federal debt and that bill will get larger every year.  However, the alternative will be sudden and very bad as Steyn points out.

It should be sobering to everyone when Steyn (a Canadian citizen who lives in the U.S.) states that due to the dollar's decline "that most Americans can no longer flee to any place worth fleeing to".  I agree with Steyn that it is time to take a stand.

Sunday, March 25, 2012

Obamacare Abomination

Oral arguments before the U.S. Supreme Court on the constitutionality of the Patient Protection and Affordable Care Act ("Obamacare") will take place tomorrow.  An unprecedented three days of arguments are scheduled.  It is one of the most important cases involving constitutional law to ever be argued before the Court.

If you are interested in the substance of the legal arguments against Obamacare you might want to read this article by Damon Root.

My guess is the Supreme Court will uphold the law.  That opinion is not based on what I think should happen but on what I think will happen.

It is extremely rare that the Supreme Court overturns a law that Congress has passed.  The most recent data available indicates that only 158 Acts of Congress have been ruled unconstitutional since the beginning of the Republic in 1789.   This really shows the influence of politics on the Court.  There seems to be a real reluctance on the part of the Supreme Court to get involved deeply in the politics of the day.  That is a big reason that I believe that the Court will not overturn the law.  The second reason is that most legal precedent seems to support an expansive reading of the Commerce Clause.  This provides the legal cover the justices will need for what I view more as a political decision.

What will be the impact of the Court's ruling?  If I am wrong and the Court finds the individual mandate unconstitutional (even if they do not strike down the entire law), I think it is the end of Obamacare.  If it is sustained, there are two possibilities.  It could cause public opinion to turn in favor of the law.  However, I think it could also become a rallying cry for its opponents in the upcoming election.

Their argument would be that the President, the Congress and the Supreme Court are all ignoring the will of the people (56% favor repeal and 39% oppose repeal according to a Rasmussen poll last week). more than two years after enactment   Interestingly, another Rasmussen poll in February found that 39% of likely voters believed that health care should be made available free to all Americans.  I bet there is a high correlation between those who do not favor repeal and who also favor free health care for everyone.  I could not find an answer as to how the 39% thought that their free health care was going to paid for.

Stay tuned as the Court's decision on Obamacare is expected in June.

If you want to read a good article on the major problems with Obamacare (and there are plenty) I suggest you read this excellent piece by Avik Roy in Forbes.  He provides a good overview some of the major policy errors in Obamacare.

You might recall that Candidate Obama repeatedly promised that health care reform "would bring premiums down by $2,500 for the typical family".   He also continually stated that "if you like your health plan, you can keep your health plan".

Many of the numbers that President Obama relied on were developed by MIT economist Jonathan Gruber.  In fact, on the eve of the health care law vote he asserted that young people would save 13%, and older people 31%, on their insurance premiums in 2016 as a result of the law.

Indeed, Jonathan Gruber promised that, based on his microsimulation model, the law would “for sure” reduce insurance premiums. And Gruber’s numbers were relied on, almost exclusively, by the bill’s most prominent advocates.
But Gruber, in a span of two years, has gone from claiming that the law would reduce non-group premiums by 13 to 31 percent, to estimating that they will increase those premiums by 19 to 30 percent. Worse still, Gruber’s model doesn’t adequately account for the law’s central feature: its requirement that insurers take on all comers, regardless of pre-existing conditions, while only weakly enforcing a nominal fine on those individuals who try to game the system.
The only thing that seems “for sure” is that there are flaws in Gruber’s model.
I had the opportunity to meet with Gruber in a small, private meeting with a number of large employers during the health care debate.  I have no doubt that Gruber is well meaning in trying to improve health care in this country.  However, he made it clear in that meeting that the major goal of Obamacare was merely to provide more access.  They had to fix access before they could control costs.  Health care cost containment would have to come later according to Gruber who said they were planning for a second bill.

Unfortunately, it is later and Gruber's numbers are showing that Obamacare is making health care costs even higher and more affordable than they were before.   It is a mess and I think it will get worse when we see the results on the individual market when the public exchanges come on line.  I have talked to a number of knowledgable people in the health care insurance industry and they believe the costs will go through the roof.  Gruber seems to now agree with that view.

As states began the process of considering whether or not to set up the insurance exchanges mandated by the new health law, several retained Gruber as a consultant. In at least three cases—Wisconsin in August 2011, Minnesota in November 2011, and Colorado in January 2012—Gruber reported that premiums in the individual market would increase, not decrease, as a result of Obamacare.
In Wisconsin, Gruber reported that people purchasing insurance for themselves on the individual market would see, on average, premium increases of 30 percent by 2016, relative to what would have happened in the absence of Obamacare. In Minnesota, the law would increase premiums by 29 percent over the same period. Colorado was the least worst off, with premiums under the law rising by only 19 percent.
Some low-income individuals would benefit from Obamacare’s subsidies; for those individuals, the impact of these premium increases would be blunted. But if premium costs go up at a rate faster than people expect, taxpayers will be on the hook for billions upon billions of extra subsidies.
I agree with Roy on what is needed if the Supreme Court does not do what it should.

The bottom line is that there is no quick fix for the Affordable Care Act’s array of policy mistakes. We would be much better off repealing the law and starting over.

Thursday, March 22, 2012

Don't Think Fast With Obama

I am currently reading Thinking, Fast and Slow by Daniel Kahneman. Kahneman is the world's foremost scholar on neuroeconomics and how we make decisions.  Adam Smythe, who reviewed the book on Amazon, does a much better job of summarizing the book than I could so a tip of the hat to Adam.
The title of this book comes from Kahneman's discussion of two simple models of how people think. "System 1" thinking corresponds to fast, intuitive, emotional and almost automatic decisions, though it sometimes leaves us at the mercy of our human biases. "System 2" thinking is more slow-going and requires more intellectual effort. To nobody's surprise, we humans are more likely to rely on System 1 thinking, because it saves us effort, even if it can lead to flawed thinking. Here is a quick way Kahneman uses to illustrate System 1 and System 2 thinking. Suppose that a bat and ball together cost $1.10 and that the bat costs $1.00 more than the ball. How much does the ball cost? Many people, relying mainly on System 1 thinking, will quickly say $0.10, but the correct answer is five cents. Think about it.
The bottom line is that when we are using System 1 thinking we are much more susceptible to errors in our judgments.  We can be lulled into a false sense of security with this fast thinking.  Anything that makes it easier for the associative machine in your brain to work will also bias your thinking.  A perfect example is familiarity.  Generally, if something is familiar you feel more confident and secure.  This can lead you astray "as a reliable way to make people believe in falsehoods is frequent repetition, because familiarity is not easily distinguished from truth" according to Kahneman.  In fact, authoritarian institutions and marketers have known this for a long time.  In effect, if you repeat a lie often enough it will tend to be believed.  This is particularly true if it is repeated often enough by an authority figure.

Keep this background in mind when you consider President Obama consistently repeating falsehood after falsehood about his record on energy.  Today he was in Cushing, Oklahoma trying to keep telling Americans he is pro-energy and pro-development.

What are the real facts?  Powerline reports on the statement of Thomas Pyle, President of the Institute for Energy Research, in response to President Obama's attempts to confuse your System 1 thinking.

President Obama wants to deceive the American people into believing that he’s somehow responsible for the southern segment of the Keystone XL pipeline, much like he wants them to think he’s responsible for increased oil and gas production in the United States. Neither claim is true, and the president knows it. 
The administration has blocked full development of the Keystone XL pipeline, from delays last fall to the outright rejection of the pipeline permit earlier this year. The president wants to reject the pipeline, and yet take credit for approving it. Similarly, he’s closed development of millions of acres of onshore and offshore federal lands for oil and gas production, while attempting to take credit for production increases on state and private lands where he has no role.
Just this week, the Congressional Research Service released a report showing that federal oil production represents 7.5 percent of the total oil produced from all U.S. lands in 2011, despite the fact that the federal government owns more than 30 percent of the lands with oil producing potential.
And the Energy Information Administration released data this month that shows oil production on federal lands is down 13 percent this year under the Obama administration. Natural gas production is at a 9 year low. These energy facts stand in stark contrast to the President’s bogus claims.
Today, the Washington Post “downgraded” the president’s record of truthfulness on America’s vast oil resources. The administration continues to claim that the U.S. only has 2 percent of the world’s oil resources. But according to his own administration’s data, America has 200 years of domestic oil supply at current consumption levels. And that’s not counting Canadian oil that the Keystone XLpipeline would bring to U.S. refineries.
Had the president authorized the Keystone XL permit in January – when he denied it – America would be well on our way to bringing more than 700,000 barrels of Canadian oil on line. That’s more than twice the oil that was produced on federal onshore lands last year, and it could have created as many as 20,000 jobs in the process.
The glaring hypocrisy of the president’s speech today is that he announced that his administration would fast-track approval of a pipeline project that the White House has no control over. And if the president has the ability to fast-track permits, why has he waited until today to use that executive authority? And why only for this project?
This administration’s record speaks for itself. For more than three years, President Obama has implemented a three part energy strategy: delay, deny, and deceive.
The most fraudulent statement he continues to make is his claim that the U.S has only 2% of the world's oil resources.  He gets that number by only counting current "proved" reserves from current and existing oil fields where drilling is being done.  This chart from Investors Business Daily tells the whole story and the facts to back it up which are taken from various government reports (yes, the federal government that President Obama oversees.)

At least 86 billion barrels of oil in the Outer Continental Shelf yet to be discovered, according to the government's Bureau of Ocean Energy Management.
About 24 billion barrels in shale deposits in the lower 48 states, according to EIA.
Up to 2 billion barrels of oil in shale deposits in Alaska's North Slope, says the U.S. Geological Survey.
Up to 12 billion barrels in ANWR, according to the USGS.
As much as 19 billion barrels in the Utah tar sands, according to the Bureau of Land Management.
Then, there's the massive Green River Formation in Wyoming, which according to the USGS contains a stunning 1.4 trillion barrels of oil shale — a type of oil released from sedimentary rock after it's heated.
A separate Rand Corp. study found that about 800 billion barrels of oil shale in Wyoming and neighboring states is "technically recoverable," which means it could be extracted using existing technology. That's more than triple the known reserves in Saudi Arabia.
All told, the U.S. has access to 400 billion barrels of crude that could be recovered using existing drilling technologies, according to a 2006 Energy Department report.
When you include oil shale, the U.S. has 1.4 trillion barrels of technically recoverable oil, according to the Institute for Energy Research, enough to meet all U.S. oil needs for about the next 200 years, without any imports.
Get familiar with the facts and engage your System 2 thinking and ignore System 1 when it comes to utterances from Mr. Obama on energy.

Wednesday, March 21, 2012

The Fork In The Road

There is a fork in the road.

Which path do you want to be on?

Compare the Paul Ryan budget path to the Obama budget path in this chart that was in The Wall Street Journal.


For anyone who believes that it does not make any difference who we send to Washington, think again.

Paul Ryan has become the most consequential member of Congress in decades.  He has led when most others are laggards. He has put in the hard work when others have just hung around in the halls of Congress.  He has shown guts when too many just get along to go along.

Here is what Time magazine said about Ryan when they named him as a runner-up as its 2011 Person of the Year.
Here's a curious fact: in a year of political gridlock, when Congress could get nothing done — not even pass a budget — the most influential American politician was House Budget Committee chairman Paul Ryan. Through a combination of hard work, good timing and possibly suicidal guts, the Wisconsin Republican managed to harness his party to a dramatic plan for dealing with America's rapidly rising public debt. He brought an ugly issue out of the foggy realm of think tanks and blue-ribbon panels and dropped it into the middle of the national debate in time to define the next presidential election. If 2012 turns out to be a clear choice between very different answers to a genuinely important question — instead of the usual vague contest between competing slogans and haircuts — give the credit to Ryan.
Time wrote about the possibility of a clear choice in 2012.  Paul Ryan is providing it.

I have written previously about Ryan in The Punter And The Quarterback.  He is a quarterback.  Unfortunately, we have a punter in The White House.

Monday, March 19, 2012

Lame Duck Drama

We are on course to the most consequential lame duck session of Congress in history later this year.  In the six weeks between election day in November and the 2012 holidays an enormous number of tax and budget issues must be dealt with.  It is unlikely any of these issues will be dealt with in normal course in this election year, and with looming expiration dates of December 31, 2012 for many of the provisions, the costs of inaction would be huge for the U.S. economy.

What is at stake?  Let's list the issues that have been kicked down the road until after the election.
  • The Bush tax cuts that were extended to December 31, 2012 in a lame duck session after the 2010 mid-term elections.
  • The Budget deal signed last August that requires $1.2 trillion in cuts to take effect January 15, 2013 with half coming from Defense and half from discretionary spending.
  • The current payroll tax holiday which will expire December 31, 2012.
  • Extended unemployment benefits that will expire December 31, 2012.
  • The Medicare doc fix that will expire December 31, 2012.
  • The federal debt ceiling of $16.393 trillion could possibly be reached in the same time period.  As of March 16, 2012, federal debt was at 15.567 trillion.  Therefore, we have $826 billion of cushion before the debt limit is reached.  Current defict spending is around $1 trillion per year-or an average of $83.3 billion per month.  10.5 months x $83.3 billion= $874.7 billion.  At this rate, the debt ceiling limit will be reached before year-end.
What are President Obama and Congress doing about all these issues right now?  Absolutely nothing.  And we can expect they will do nothing until after the election.  We are looking at a very busy November and December.  Of course, the likely casualty in all of this is likely to be good public policy.  Rushed decisions and last-minute political deals do not normally produce the best results.

Overhanging all of this drama is the fact that the decisions will be made by some who will no longer be in power in a few weeks.  That might include the President.  It is both scary and scandalous that we are running the country in this manner.

The odds are that the can will be kicked further down the road.  However, the can has a lot of dents and dings by now.  At some point it is going to break.


Sunday, March 18, 2012

Three Troubling Tidbits

Everyone is anxious for good news on the economy, employment and our budget problems.  The mainstream media seems to be particularly interested in painting an optimistic picture with the election approaching.  They seem eager to jump on any data that might suggest that the economy is improving to help the cause of President Obama. 

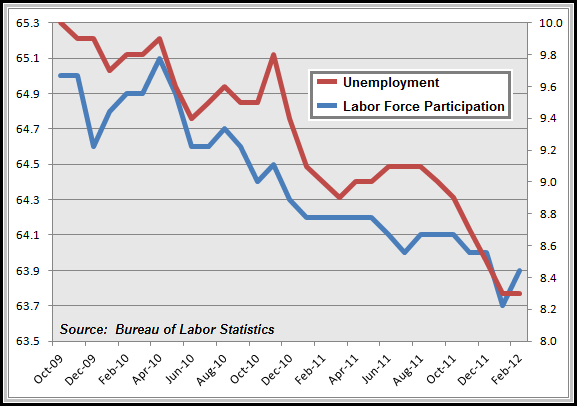
We did see the most positive employment data in a long time last month.  I have written previously that I am more focused on the labor particpation rate than the unemployment rate.  It tells us how many working age people are actually working.  Until last month it had been consistently falling since President Obama took office.  Of course, we have also been told that unemployment has been falling so something does not add up.  This chart shows the unemployment rate and the labor participation since October, 2009.  The Obama stimulus package was passed in February, 2009.  Is there any indication here that this $787 billion package produced any visible results?

The increase in the labor participation rate last month from 63.7 to 63.9 is positive news.  However, about 5 million fewer people are working today than when President Obama took office based on the labor participation rate numbers.


Some have argued that the lower labor participation rate is a function of the increasing number of baby boomers entering retirement.  However, the facts do not back this up.  In fact, more individuals age 55 and over are working today than at any time in recent history.  This chart from Tyler Durden at Zero Hedge tells the story.


We will have to wait and see whether last month's improvement in the labor participation rate is a trend or merely a temporary blip. However, the trend in this rate over the last couple of years has been very troubling especially when we are being told that unemployment is dropping.

In the last week I came across two other troubling tidbits that are telling me that we still have some serious underlying issues that need to be dealt with.

In February, the United States government had a $232 billion deficit for that one month.  That is higher than the February, 2011 total of $223 billion.  To put this in further context, in President Bush's last year in office, the deficit for the entire year was $458 billion.  We still seem to be heading in the wrong direction.

The news is even worse in California.  In February, state revenues in the "Golden State" ( they might need to rethink that nickname) dropped 22% compared to last year. That is a $1.2 billion shortfall in just one month compared to what was collected last year.  This is a state in serious trouble.  It's top income tax rate is already 10.3%-the second highest in the U.S.  Anyone making over $46,766 per year pays a tax rate of 9.3%.  The state sales tax is 7.25% but local taxes can make it as much as 9.25%.  However, it is still not enough.

Governor Jerry Brown is proposing to take additional tax increases to the voters for approval in November that would increase rates on taxpayers making over $250,000 (those making over $500,000 would see a 12.3% tax rate).  The proposal would also increase the state sales tax by .25% across the board.

However, the top 1% of income earners in California already pay about 40% of all income taxes collected in the state.  This is about double the perentage of income they earn.  The chart below is from California's Legislative Analyst's Office.  Note that during the 2000 internet stock boom and in the 2006-2007 stock and housing boom that the share of taxes collected from the rich almost hit 50%.  This is the danger of tax systems that rely on heavily progressive tax structures, particularly where capital gains are taxed the same as ordinary income.  The share of income of the top 1% is skewed with capital gains that can easily disappear.  California is paying the price for that over reliance right now.
However, a more fundamental problem for California is the fact that the Top 1% income earners are very mobile.  How many businesses and top income earners have moved out of the state the last few years?  How many more will leave in the wake of even higher tax increases on the horizon.  California is at the tipping point.  And it is not tipping the right way.

If there is any good news in the California story it is that it should be a cautionary tale to the rest of the country and the federal government.  We will see how this plays out.  However, my guess is that we are going to see things get much worse in California.  A good plan for the federal government would probably be to do exactly the opposite of what has been done in California over the last 25 years.

Saturday, March 10, 2012

SOS...Save Our Savers


4 US Code Section 8: Respect for flag
"a. The flag should never be displayed with the union down, except as a signal of dire distress in instances of extreme danger to life or property."


If you are a saver you are in dire distress.  There is extreme danger to your property.  The Federal Reserve  low interest rate policy is targeting savers to benefit debtors.  It is another example of the redistribution of America.  Savers are being penalized to bail out debtors.  People who did the right thing are paying for those who did the wrong thing.  Of course, at the top of that list are big banks and big government.  

According to the Bureau of Economic Analysis, the interest income of Americans dropped from $1.4 trillion in 2008 to less than $1 trillion in 2011.  Who are the biggest losers?  Patient, quiet, conservative savers who spent less than they earned over many years and put their money into savings accounts, CD's, money market funds and bonds. They worked hard to accumulate their nest egg and wanted to put their money in a safe place.  They are not interested in speculating in stocks or cashing in on commodities.  However, federal policies are robbing these savers of their hard earned money every day.

To put this amount of money in perspective, consider that the FICA payroll tax holiday carries a cost of $120 billion for the year.  This was supposedly done to put more money in people's pockets.  However, lost interest income to savers has taken well over 3 times that amount from savers.

If a $400 billion tax increase had been enacted on savers no one would stand for it.  However, we have seen this massive redistribution occur over the last three years with very little noise.  What is particularly troubling is that a lot of this cost has fallen on senior citizens who are paying this very high cost penalty on their life savings.  

It is time that someone starts to speak up for our savers.  I am putting the SOS flag out.  It is time to Save Our Savers.


Thursday, March 8, 2012

Mitt Math

Super Tuesday is behind us and it seems to be a good time to revisit the Republican Presidential Primary race.

I wrote in December before the primary season began that I believed that Mitt Romney, Newt Gingrich and Rick Santorum were the strongest potential Republican candidates in the race.  The voters have agreed with that assessment.  There have been primaries or caucuses in 22 states thus far.  Romney has won 14 contests, Santorum has won 6 times and Gingrich once.  Of almost 7 million votes cast for these top 3 (Ron Paul has captured less than half of the votes of #3 Gingrich) Romney has garnered 46% of the votes, Santorum 28% and Gingrich 26% according to Real Clear Politics.

However, delegates are what matter when you are looking to gain the Republican nomination.  It takes 1,144 to win in Tampa in August.  Romney has 409, Santorum 163, Gingrich 111 and Ron Paul 61 through Super Tuesday.  There is a long way to go but catching Romney in the delegate count is a lot like    trying to graduate cum laude from college when you have a 2.7 GPA halfway through your Sophomore year.  It may be mathematically possible but you need to pull down nothing but A's the rest of the way.

Senator Santorum and Speaker Gingrich are in a similar position.  Santorum needs to win an estimated 64% of the remaining delegates and Gingrich needs 67%.  Romney only needs to win 48% to seal the deal.  This is the Mitt Math that puts Romney in the driver's seat.

At this point it is difficult to see a path that would lead anyone else but Romney to get the delegates they need before the convention.  The primary calendar does not favor Romney over the next couple of weeks.    Alabama, Mississippi, Missouri and Louisiana all look to be good opportunities for Santorum or Gingrich to make some inroads into Romney's lead.  However, proportional voting is likely to limit the progress they can make.  For example, if you look at Santorum's wins in Oklahoma and Tennessee on Tuesday night, he only picked up 15 more delegates than Romney did out of 98 delegates in play.  On the other hand, Romney gained 113 delegates on Santorum from his wins in Virginia, Massachusetts and Idaho.

Split decisions are not going to work for Santorum or Gingrich over the next few weeks.  They need to pick up delegates and shut out Romney in these upcoming races or the odds get much longer.  However, even if they can pull this off, states like Illinois, Wisconsin, Maryland are next on the horizon in late March and early April and look promising for Romney based on past results.

The date that I am looking at very closely on the primary calendar is April 24.  231 delegates are at stake in New York, Pennsylvania, Connecticut, Rhode Island and Delaware on this day.   This may prove to be the defining moment in the campaign.  All of the states but Pennsylvania appear to be good territory for Romney.  If he falters, it could be the opening the challengers need to take it all the way to Tampa.  On the other hand, if he comes through strong and also gives Santorum all he can handle in the Keystone State, it might put Romney in a position to walk the rest of the way to the finish line.

Looming large if the primary season stays competitive beyond April are the elections in Texas (May 29) and California (June 5).  327 delegates are in play-155 in Texas and 172 in California.  Those two states represent almost 30% of the delegates a candidate needs for the nomination.  This is the big prize that keeps hope alive for the challengers.  Texas is a winner take all state if one candidate takes over 50% of the total vote.  California is winner take all on a district by district basis.  There is a lot of potential for big gains here but will it be too late for the challengers?  Unless Santorum or Gingrich can close the delegate gap with Romney over the next month, it may not matter.  Keep your eye on the Mitt Math to see if it will matter.


Tuesday, February 28, 2012

The Middle and The Rich

There is a wealth of data in the IRS Statistics of Income Bulletin.  I recently looked at some of the information in the Fall, 2011 bulletin relating to the 2009 tax year.

I was particularly interested in looking at those taxpayers in the $50,000-$200,000 range in adjusted gross income.  There were 43.7 million returns filed for these income ranges in 2009.  You might call this "The Middle" as this probably represents a broad definition of what many would consider middle income taxpayers in the United States.  However, recognize that there were 93 million returns filed with incomes below $50,000 and about 4 million filed with incomes of $200,000 or above.

Consider these facts about "The Middle"(incomes between $50k-$200k).

  • $4.1 trillion out of total reported income of $7.7 trillion were to those in The Middle (53% of the total)
  • $3.1 trillion of $5.7 trillion in salaries and wages were earned by The Middle (54%)
  • $59 billion of $168 billion in interest income was earned by The Middle (35%)
  • $51 billion of $163 billion in dividends was earned by The Middle (31%)
  • $218 billion of $362 billion in capital gain distributions (principally from mutual fund investing) were earned by The Middle (60%)
  • $35 billion of $240 billion in long term capital gains came from The Middle (15%)
  • $484 billion of $823 billion of pensions and annuities came from The Middle (59%)
  • $677 billion out of $1.2 trillion in itemized deductions were from The Middle (56%)
  • $2.7 trillion out of $5.1 trillion in taxable income came from The Middle (53%)
  • $371 billion out of $866 billion in total income taxes were paid by The Middle (43%)
Consider these facts about "The Rich"( incomes over $200k)
  • $2.0 trillion out of total reported income of $7.7 trillion were to The Rich (26%)
  • $1.1 trillion of $5.7 trillion in salaries and wages were earned by The Rich (19%)
  • $64 billion of interest income of $168 billion in interest income was earned by The Rich (38%)
  • $86 billion of $163 billion in dividends were earned by The Rich (53%)
  • $41 billion of $363 billion in capital gain distributions were earned by The Rich (11%)
  • $185 billion of $240 billion in long term capital gains came from The Rich (77%)
  • $102 billion of $823 billion of pensions and annuities came from The Rich (12%)
  • $305 billion out of $1.2 trillion in itemized deductions were from The Rich (25%)
  • $1.6 trillion out of $5.1 trillion in taxable income came from The Rich (31%)
  • $434 billion out of $866 billion in total income taxes were paid by The Rich (50%).
A few observations.
  1. The Middle earns the bulk of the salaries and wages (54%), capital gains distributions (60%),  and pensions and annuities (59%).  They also claim more than half of the itemized deductions (56%). In fact, the amount of these deductions is also more than twice what The Rich claim (25%). 
  2. The Rich are rich not due to the their salaries and wages (they only account for 19% of the salaries compared to 54% for The Middle) but because of their investments.  53% of the dividends and 77% of the long term capital gains were earned by The Rich.
  3. The Middle had 53% of the taxable income but paid 43% of the total income taxes.  The Rich had 31% of the taxable income but paid 50% of all income taxes.  Despite what you may hear from time to time, this is a very progressive tax system.  Those below The Middle pay almost nothing in income taxes.  Those in The Middle are also big beneficiaries of the current tax system.
  4. The only way to raise any substantial amount of additional taxes on The Rich is to increase tax rates on dividends and capital gains.  However, you could tax both of these items at a 100% tax rate on the rich and you only would only reduce this year's projected budget deficit by less than 30%.
  5. The only way to raise significant amounts of income tax revenues is to increase tax rates on incomes in The Middle.  As you can see from the statistics above, this is where the bulk of the income earned in this country comes from and this is the group that benefits the most from the large numbers of deductions and credits.

Sunday, February 26, 2012

The Mighty Macs

I doubt many people have ever heard of Immaculata College.  Hint-It is located about 20 miles west of Philadelphia.  I would also suspect that few people know which team won the first women's national basketball championship.  Hint-It was held in 1972.

That first national championship was won by Immaculata College which had less than 500 female students.  They also went on to win the national championship in 1973 and 1974, played in the national finals in 1975 and 1976 and made it to the Final Four in 1977.  Their coach was Cathy Rush who quit college coaching after seven years at age 30 with a 149-15 record.

The story of Cathy Rush and Immaculata was recently made it into a movie, The Mighty Macs, that is now available on DVD.  It is a inspirational story that shows the power of hard work, heart, focus and faith.  Rush expected a lot out of her players and believed that they could be #1.  In fact, she passed out buttons early in her tenure to everyone with the inscription , "We will be #1".

Immaculata won the national championship in 1972 by beating a team (West Chester University) in the finals that had beaten them by 32 points just one week before in a regional tournament.  Cathy Rush was one great coach.

This is further evidenced by the success some of her players had as coaches in their own right after they left Immaculata.

  • Theresa Shank Grentz
    • Head coach at St. Joseph's, Rutgers and Illinois
  • Rene Muth Portland
    • Head coach at Penn State
  • Marianne Crawford Stanley
    • Head coach at Old Dominion (3 NCAA championships), Penn, USC and Cal-Berkeley

If you are looking for a nice G-rated movie with a message, you can't wrong with The Mighty Macs.