
Despite all that you hear and read that the rich do not pay their "fair share" of taxes, the truth is that they pay quite a bit.
I guess it depends on what your definition of "fair" is.
The Tax Policy Center recently updated its analysis of the distribution of income taxes by income groups so you can assess "fairness" more objectively.
It shows that the top 20% of taxpayers by income will pay 84% of the income tax burden in 2017.
After the Trump tax cuts, the top 20% of taxpayers will pay 87% of the tax burden in 2018.
It kinds of makes you wonder what the Democrats were talking about when they unanimously opposed the tax cuts last year that they said were a giveaway to the rich. Everyone else supposedly got mere "crumbs" according to Nancy Pelosi.
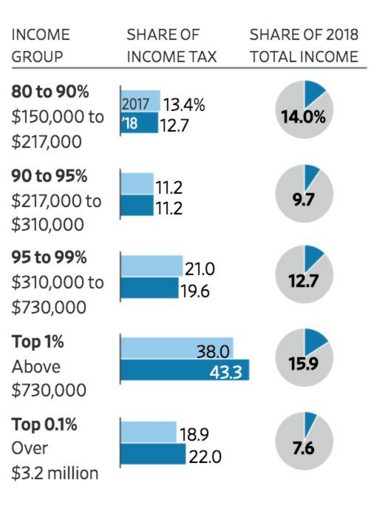 |
| Note: Top .1% group is also included in Top 1% numbers above Credit: Tax Policy Center via Wall Street Journal |
For context, the top 20% derives 52% of the income but are bearing 87% of the tax burden in 2018.
Many argue that the top 1% are getting a outsized portion of the nation's income and should be paying a higher tax burden.
It is true that the top 1% is deriving 16% of all income. However, this group will be paying 43% of all individual income taxes in 2018 (up from 38% in 2017).
What about the bottom 80%?
They generate almost half of all income but will pay just 13% of the income tax burden in 2018.
Where do the 1% reside who are bearing such a large portion of the individual tax burden?
Bloomberg recently did an analysis of 2015 IRS data by zip code in order to answer that question.
It turns out that Fisher Island, which is an island just off of Miami Beach, Florida, had the highest average annual adjusted gross income of any zip code in the United States---$2.5 million.
The underlying data on the income of those rich people on Fisher Island also supports a point that I have made in these pages before. The income of the rich, by and large, does not come from their labor. Outside of entertainers and professional athletes, it is difficult to generate large amounts of income from the sweat of your brow. It has to come from either getting your money to work for you or being able to mobilize others to work for you in a business enterprise.
Average salary income on Fisher Island was $668,000 of the $2,543,000 of AGI----only 26%. Dividends, interest, capital gains and income from a business brought in most of the bacon.
I published this chart last year that shows the components of gross income based on Congressional Budget Office data on the distribution of household income and taxes by households in 2013.

I don't know that I have ever seen a better graphic to show where the jobs come from that pay the labor income, or the taxes that pay for the government transfers that the bottom 80% rely on to live on, than what you see above.
How about the redistribution of income? Consider that 38% of before-tax income of the lowest quintile of income earners is in the form of government transfers (Social Security, Medicare, Welfare) that involves taxing the rich to pay for these benefits.
The so-called 1% could also get their name from the amount of their income they are getting in the form of similar government transfers---a mere 1%.
What is also interesting is the degree to which the middle class in the 3rd and 4th quintiles are reliant on income from labor to support themselves--about 2/3 of their household income comes from labor income. Only 2%-3% of their income is coming from capital income and gains.
On the other hand, the Top 1% derives only 35% of their income from labor. Almost 2/3 of their income comes from business income (23%) and capital income and gains 38%).
If you want to live in an ultimate zip code some day, my advice is to save and invest so you can get your money working for you or create a business where others work for you and they share their productivity with you. This is what the people in these zip codes have done.

A few other interesting bits of information I picked up from the Bloomberg data.
Highest median home price---Atherton, CA (94207) $6.7 million
Highest average tax deductions---Palo Alto, CA (94301) $491,600 (high mortgage interest, property taxes, state income taxes)
Largest 5-yr increase in avg. AGI---Palo Alto CA (94301) +220.7%
Worst 5-yr increase in avg. AGI---New York City (10005) -16.6%
For additional perspective, here are the top 10 zip codes by adjusted gross income for each of the four major regions of the United States.
Northeast

Midwest

South

West

How about a tax day salute to the taxpayers in these zip codes who carry so much of the burden of paying for our government services? These same people are also responsible for providing many of the jobs that sustain so many American families.
They richly deserve it, don't you think?
Of course, I understand it still depends on what your definition of "fair" is.
 |
| Credit:Pinterest.com |
 |
| Credit: Pinterest.com |
For those who might actually be interested in assessing "fairness' factually , pass this blog post along.
No comments:
Post a Comment