A few charts and graphs that provide some interesting insights on the world we live in right now. They might even make you go Hmmmmmm!
The Political Divide
A lot of people wonder about the political divide in our country.
This chart from the Economist.com provides some perspective.
In 1994, when Bill Clinton was President, there was not much difference in the the political ideology of Democrats and Republicans.
By 2017, a massive divide had developed.
The average Democrat in 1994 was right in the middle (5 out of 10) on a scale that measured ideology from consistently liberal to consistently conservative.
The average Republican was a 6 out of 10--- a little right of center.
In 2017, the average Republican was rated at 6.5---just slightly more conservative than in 1994.
However, the average Democrat was a 2 on that scale. That is a massive shift left.
If you wonder where the political divide is coming from today look no further than this chart.
Who is further from the center?
The Stock Market
The stock market has been on an incredible run this year.
Stock prices are subject to the same economic rules of supply and demand as anything else.
2021 has seen an unprecedented amount of money that wants to be invested in stocks.
Consider this chart from The Wall Street Journal's The Daily Shot.
There have been more inflows to equities in 2021 (annualized) than in the previous 20 years combined!
That is a lot of demand. That demand has been fueled by an abundant supply of money due to Federal Reserve policies and federal government stimulus actions.
When combined with record low interest rates on bonds, this has motivated investors to move their investments from fixed income investments and assume more risk in equities.
You can see this as well in the TD Ameritrade "Investor Movement Index" that shows the exuberance of retail investors about the stock market. The sentiment has never been more positive.
What could go wrong?
 |
| Source: https://twitter.com/SoberLook/status/1412707642372415489/photo/1 |
People Die From Things Other Than Covid
While deaths from Covid have been in the news every day for the last 18 months, people die from a variety of causes.
I thought the graphic below was an interesting perspective on the numbers who are killed by various members of the animal kingdom.
Everyone is concerned about shark attacks because of the publicity they receive in the media (does this remind you of anything?) but did you know that ants kills 6 times as many people as sharks do in a typical year.
 |
| Source: https://twitter.com/theRoddick/status/1408759614607351812 |
Looking at this data, I would also suggest that you give a wide berth to any hippos you might encounter.
Is the Pandemic Over?
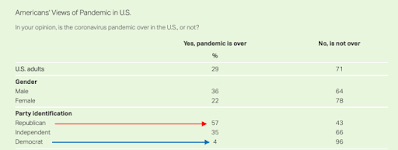
57% of Republicans say the pandemic is over. Only 4% of Democrats agree. This is based on a recent Gallup survey.
 |
| Source: https://news.gallup.com/poll/351650/three-americans-think-pandemic.aspx |
The political divide I mentioned above clearly applies to attitudes about the pandemic as well.
You can also see an enormous divide in Restaurant Reservations Data that Open Table reports between eateries in states like Florida, Texas and Nevada compared to what is going on in restaurants in California and New York.
Activity at restaurants in Ft Lauderdale is up +40% compared to what they were seeing in 2019 before the pandemic.
Restaurants in San Francisco, Seattle, Minneapolis, New York, Portland and D.C. are down more than 50% from 2019 levels.
 |
| Source: https://twitter.com/arrington/status/1410782004728184837/photo/1 |
Politics seems to influence everything these days.
The Wild Ride in Jobs
A year ago we were wondering how many would have a job in a year.
We now see "Help Wanted" signs wherever we go and many employers say that their biggest challenge is finding people to work.
Voluntary resignations by employees just hit a record high.
 |
| Source: https://twitter.com/SoberLook/status/1402556483645198349 |
At the same time, employers are letting go of fewer employees than ever. I guess they have decided a warm body is better than nobody even if they are not competing for employee of the month. If they discharge someone they may not be able to fill the position.
 |
| Source: https://www.axios.com/layoffs-all-time-low-656979a1-38e0-48d4-b3bb-5ad9b5345aa3.html |
This chart sums up pretty well the wild jobs ride since the pandemic started.
 |
| Source: https://twitter.com/sam_a_bell/status/1410190377357819908 |
How Many Friends Do You Have?
The number of close friends that people have has dropped dramatically since 1990.
It has particularly affected the friendships among men. 15% of men report having no close friends.
The decline in friendships has also been more acute in the young than in those who are older.
It seems that the internet, iPhones, texting, Facebook and all the rest, which were supposed to allow us to connect with each other in better ways, has just gotten in the way of developing friendships.
 |
| Source: https://www.americansurveycenter.org/why-mens-social-circles-are-shrinking/ |
Do you think that we should be just as concerned with the number of friends these young men have rather than be worried about whether they own a gun?
What is the one thing we almost always hear when there is a mass shooting?
"He was a loner."
Hmmmmm.


No comments:
Post a Comment