A few random observations, charts and factoids to provide some context on what is going on in the world.
Personal Savings
The personal savings rate is in free fall as a result of the expiration of Covid relief programs and inflation that has squeezed the household budgets of Americans.
The personal savings rate has never been lower.
Things were great two years ago as government checks filled bank accounts while no one had anywhere to spend the money due to lockdowns.
It is a different story today.
Personal savings of $4.85 billion was registered in 2020's second quarter. Last quarter the personal savings of Americans had dropped to only $685 million according to the Federal Reserve.
Personal savings has disappeared as real personal disposable income has gone negative like nothing we have seen.
How is the consumer still spending?
Credit cards to the rescue.
How long can this continue?
Home Sales
U.S. pending home sales are also in the midst of their biggest decline in over 20 years.
The declines have been faster and deeper than what was witnessed in the 2009-2011 financial crisis.
 |
| Credit: https://www.zerohedge.com/personal-finance/us-pending-home-sales-plunge-biggest-annual-drop-ever |
Unemployment
The unemployment rate has not nudged up yet but that might be about to change.
Challenger (an executive recruiting specialist) maintains a database that tracks job layoff announcements. This index typically is ahead of the actual unemployment claims that follow the layoffs.
The Challenger index is forecasting bad news over the next few months.
 |
| Credit: https://www.zerohedge.com/personal-finance/continuing-jobless-claims-hit-10-month-highs-layoffs-exploded-november |
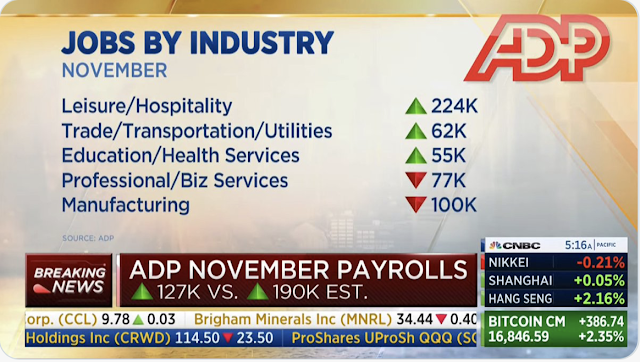
In addition, the latest ADP jobs employment report shows that 100,000 manufacturing jobs were lost last month. Professional and business services lost another 77,000 jobs.
The good news is that there were a lot more bartenders, waitress and hotel hospitality jobs being filled.
All will be good for them until the credit cards max out.
 |
| Credit: https://twitter.com/DontWalkRUN/status/1597976685487738881 |
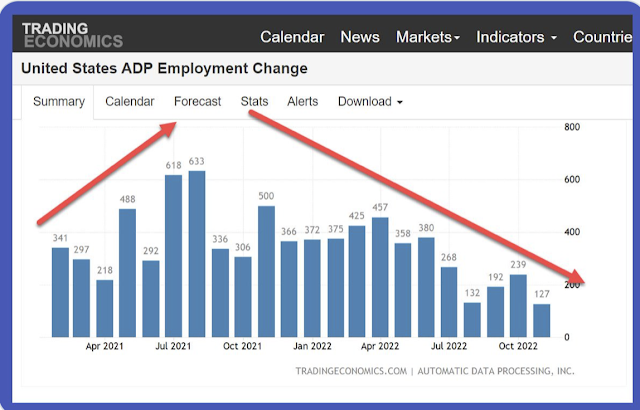
Overall net employment growth is slowing according to ADP.
 |
| Credit: https://twitter.com/CortesSteve/status/1598026014701268993 |
How long before it goes negative?
It's About the Environment?
In order to transition away from fossil fuels, and rely on solar, wind and electric vehicles, is going to require a tremendous amount of copper. This is a key resource in all of these so-called "green energy" initiatives.
For context, over the last 5,000 years, humans have mined 700 million tons of copper.
To meet the energy transition targets that have been established by the climate change lobby, it will require another 700 million tons of copper to be be mined over the next 22 years.
It also takes, on average, 16 years of lead time to open a copper mine in the United States considering regulatory and other issues.
Cobalt, graphite, lithium, nickel and vanadium are other metals that are required for green technologies.
Compare the requirements for these key minerals to known reserves.
It seems that something does not add up in all of this.
 |
| Credit: https://twitter.com/BrianGitt/status/1595063248092819456 |
I have no doubt that tremendous innovations and advancements will be made in the future.
More reserves will be found. Better extraction techniques will be discovered. Alternative metals will be utilized.
However, to have any government mandating the abolition of energy sources that work well today for things that are unproven is a recipe for disaster.
What is the greater potential disaster?
Climate change?
The response to perceived climate change?
Climate Change?
What is going on right now with temperatures around the world?
The United States.
These charts compare actual temperatures compared to averages (green/blue colder, orange, yellow warmer).
India.
Australia.
 |
| Source: https://www.theguardian.com/australia-news/2022/nov/30/australia-weather-second-wettest-spring-ever-coldest-in-decades |
Remember that all of the alarm about climate change was originally supposed to be because increased carbon emissions were going to raise temperatures, melt the ice caps, flood coastal areas and cause droughts that would curtail food supplies.
Now these same charts are used by many to argue that climate change is occurring.
Yes it is. As it has since the dawn of time with man or without.


No comments:
Post a Comment