
Friday, June 27, 2014

California Dreamin'

I just got back today from five days in the San Diego, California area.

LaJolla, California


I love to visit California. It has spectacular weather, stunning views and splendid places to see. I just could not live or work there due to its current tax, business and political climate. Ironically, if it were not for its other climate factors-sun, surf and Silicon Valley- I am not sure where California would be right now. I can assure you it would not be good.

I can predict with reasonable certainty that California is facing very dire financial problems at some point in the future. It has built a governmental edifice on a foundation of tax policies that is weaker than the San Andreas fault. It is just a matter of time before it breaks.

Today it is hard to believe that California was where the modern tax revolt began in this country over 35 years ago with the passage of Proposition 13 that limited increases in property taxes in the state. Proposition 13 was enacted through initiative in California and it also marked the beginning of increased voter activism through the initiative process.

Prop 13 was the defining moment when citizens stopped trusting their elected officials to represent them and recognized that most of the time politicians were only taking care of themselves and their special interests.  Politicians are not naturally disposed to want to limit taxes.  After all, tax revenues are their lifeblood. Without tax dollars to pass out and redistribute, politicians have no power.

The problem with Prop 13 in California was that it was limited to property taxes. It did not place any direct limits on income, sales or other taxes (although it does require a 2/3 vote to increase taxes via the legislature). You see the results in California today.

The top individual income tax in California is now 13.3%.  The tax brackets are extremely progressive (matching the political environment).  Income tax rates are 1% for the first $7,582 of income but a single filer is taxed at 9.3% of adjusted gross income on anything above $49,774. This means that most working households are paying almost 10% in marginal income tax rates.

Compare that to Ohio were I live where the top marginal rate is now 5.92%. The rate is 4.11% for a single filer with $50,000 of income.  Sales tax in the county where I live is 6.75%.

I paid 8% in sales tax on several purchases while I was in the San Diego area (anything I can do to help out).  However, in some cities in California the total sales tax is as high as 9.5%.  Therefore, middle class households in California are shelling out almost 20% of their marginal income just for state income and sales taxes!  That is about twice as much as the middle class household in Ohio.

Combine that with sky-high housing costs in California and you can readily see the exorbitant cost of living with all that sun, surf and some Silicon Valley millionaires close by.

Speaking of millionaires it was amazing to drive down along the coast through Carlsbad, Del Mar, LaJolla, Pacific Beach and Coronado and see the construction and remodeling work being done. If you want to see trickle down economics it was there to see.  People want to complain about the rich but I saw scores of plumbers and carpenters on those sites working and I also saw tons of people at bars and restaurants redistributing money through the private sector while I was there.

A major problem for California is that it has become increasingly reliant on that progressive income tax system and a dwindling number of rich taxpayers to foot the bill for most of the state's services.  For example, nearly 50% of income tax collections are for those in the top 1% of income earners and 67% of all of the state's tax revenues are coming from the personal income tax.

For those who want to argue that they are "rich" so it is only fair that they pay more, consider the following chart that shows that the top 1% in California consistently have paid double their share of income in taxes. In other words, the top 1% are earning about 20-25% of total income but are paying 40-50% of total income taxes in any given year.
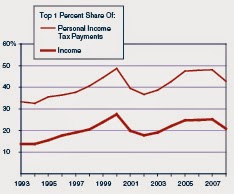

California Legislative Analyst's Office


How many people is that?  Less than 150,000 taxpayers.  The population of California? 38 million. That is a very big burden placed on a relatively small number of income earners.


Personal income taxes in California have also become the most significant revenue source in the state over the years. They now represent about 2/3 of all revenues to the state-almost triple their share compared to 1970.


California Legislative Analyst's Office


California State Controller's Office


California has also become dangerously dependent on those top income earners pulling in large capital gains and income from stock options.  You can see that in the spike in incomes of the top 1% in 2000 and the 2005-2007 period.  The reality in California is that the share of income of the top 1% is very volatile in that it is so dependent on stock options, the stock market, real estate investments and capital gains.

You can also see it in the recent trend in income tax collections compared to sales tax and corporate income taxes.  It is very telling that sales tax collections in California were essentially the same in 2013 as they were in 2003 but income tax collections more than doubled.


California State Controller's Office


Thank you Google, Facebook, Amazon and many others who made it happen.  Thank you Ben Bernanke and Janet Yellen and low interest rates.

However, can California keep the people in the state who made these ideas a success?  Can they attract new talent and capital to the state over the long term with the tax, regulatory and political climate they currently have in place?

And what happens to California if interest rates climb and tech stocks fall?

As the Mama's and Papa's put it in their song, California Dreamin', it will be a winter's day but I doubt you will be safe and warm in L.A.

All the leaves are brown 
And the sky is grey 
I went for a walk 
On a winter's day 
I'd be safe and warm 
If I was in L.A. 
California dreamin' 
On such a winter's day 

At that time it might also be time to stop in the church and do something more than pretend to pray.

I stopped into a church (stopped into a church) 
I passed along the way (passed along the way) 
You know, I got down on my knees (got down on my knees) 
And I pretend to pray (I pretend to pray) 
Oh, the preacher likes the cold (preacher likes the cold) 
He knows I'm gonna stay (knows I'm gonna stay) 
Oh, California dreamin' (California dreamin') 
On such a winter's day 

Wednesday, June 18, 2014

So Wrong About So Much At The Expense Of So Many

I have not written as many BeeLine posts this year as I have in the past. I have tried to determine exactly why that is. Three possible reasons come to mind. By coincidence or not, all of my reasons begin with the letter "D". I guess that letter is on my mind because I am just hoping we can get to a "D" grade level in Presidential leadership right now.

Discouragement- Quite frankly, the news every day is not encouraging. I find it harder to write and comment on the issues of the day when everything seems to be unraveling. It is especially discouraging knowing that a lot of this was avoidable. The American people had a choice two years ago about our leadership and our future and made the wrong one.

I wrote this the day after the 2012 Presidential election.

The results of yesterday's election clearly show that we are in The Fourth Turning. History is not made by events but by the reaction of human beings to events.  We saw clear evidence of that yesterday. We are hurtling down the road for a rendezvous with history of our own making.  Two clearly marked paths were there for choosing.  The American people made their choice.   We all will have to deal with where it leads.
Choices have consequences.  We will learn what they are together.  For better or worse. Our only hope now is that the President we elected yesterday is not the same leader we had for the last four years.

The sad truth is that we are all finding out that the President we have is actually much, much worse than was even evident in his first four years. No wonder I am discouraged.

Disinterest- I care a lot about our country, my fellow Americans and our future. I have spent hours pondering the issues of the day and hours more crafting and formulating perspectives and prescriptions for solutions to some of our problems in these pages. However, when the President of the United States seems more interested in playing golf, attending political fundraisers and playing endless political games than dealing with the issues in front of him, it is easy for everyone else (including me) to put my time and attention elsewhere.

If the President can play golf over the weekend while Iraq implodes and we still don't know what he was doing the night of the attack on the Benghazi consulate than more important than four American lives (including an American ambassador), I don't feel so bad in not cranking out two or three BeeLine posts per week.

I am reminded of this quote by Harry S. Truman that seems apt today.
Men make history and not the other way around. In periods where there is no leadership, society stands still. Progress occurs when courageous, skillful leaders seize the opportunity to change things for the better."
Courage? Skill? Seizing opportunity? Using this definition, Barack Obama is the antithesis of a leader. Our society is not standing still, it is in retreat.


Deja Vu- I also can't shake the feeling that I have seen and experienced all of this before. It seems like I am living it all over again.  After all, I was around when Nixon and Carter were Presidents. I saw the corruption of the Nixon administration and the incompetence of Carter. ( I am also happy to report that I did not vote for either one).  It is hard to believe but the Obama administration seems to have combined the worst aspects of both of these failed Presidencies and combined it into a colossal conglomeration of corruption, chicanery, circumvention of the Constitution and clear-cut incompetence.

I like how former Vice President Dick Cheney and his daughter, Liz, put it in an op-ed in The Wall Street Journal today.

Rarely has a U.S. president been so wrong about so much at the expense of so many. 

Am I being too critical?

Consider the following that have come from the headlines in just the last few days.

White House Honors 10 Young Illegal Immigrants
If this is not bad enough, President Obama does it at the same time there is a flood of young, illegal immigrants overwhelming our border authorities.  Of course, all this will do is incentive more illegal immigrants to do the same. The operative word here is "illegal". What happened to the rule of law? What happened to faithfully executing the laws of the United States of America in accordance with the Constitution?

Obama Administration Suggests U.S. May Join with Iran to stop ISIS in Iraq 
Does anyone remember that Iran is probably directly responsible for at least 1/3 of our combat deaths in Iraq?

Obama's Unbelievable Lost IRS Emails For Lois Lerner and Six Others
Richard Nixon was impeached and ultimately resigned due to an 18.5 minute tape erasure on a key piece of evidence about the Watergate coverup and for using the IRS for political purposes.  What more can be said?

I have said it before and I will say it again, I believe than in the fullness of time the history books will judge President Barack Obama very harshly. Future generations will likely wonder how the American people could have let themselves be bamboozled by someone who when, viewed in retrospect, was not much different than a 19th century snake oil salesman.  Articulate and personable with a nice smile who was great on the stump.  However, in the end, that was all there was.

So wrong about so much at the expense of so many.  It is a long way from hope and change.

And do you understand why it has become so much harder to write this blog?

Thursday, June 12, 2014

Boom and Bust?

10,000 baby boomers retired yesterday. Another 10,000 retired today and an additional 10,000 will retire tomorrow.

We are in the early stages of what will be a massive number of people leaving the workforce and beginning "life without a paycheck".


Credit: RickLadd.com

The retirement trend will continue for another decade before it begins to level off but the effects of this age wave will continue for years to come.


By 2050 it is projected that there will twice as many Americans over the age of 65 as there are today. We are talking about 90 million people or 20% of the nation's population.  To put that in context, the U.S. population was only 150 million in total in 1950.  It will be as if the entire United States resembles Florida's demographic makeup today (actually Florida's age 65 and over population is only 18% today.)

If you don't think this is a tidal wave consider the fact that Cerulli Associates predicts that the 401(k) system will become cash-flow negative beginning in 2016.  Simply stated, there will be more money being withdrawn from 401(k) plans from people retiring than there is money being put into 401(k) plans by those still working. Cerulli projects that $366 billion will be withdrawn in 2016 compared to $364 billion in inflows.

How well are all of these seniors prepared for retirement? Few outside of the public sector has a pension plan to rely on. What lies ahead in the future?  Social Security and Medicare programs will undoubtedly face severe financial strains.   Where will the money being withdrawn from 401(k)'s be invested? What will that mean to the equity and bond markets? Can seniors really rely on the "promise" of Social Security and Medicare?

There are many clouds on the horizon for those people retiring right now. Where can they earn a "safe" yield in a low interest rate environment? What about inflation? What about health care and the effects of Obamacare on the system?  1 out of 3 practicing physicians are over the age of 55 themselves. One survey I saw predicts a shortage of 120,000 doctors by 2025-that is a mere nine years away. What about the long-term value of the dollar?

I am getting a headache, get me a doctor! There are gray skies on the horizon everywhere you look.

As troubling as the questions are today, a secure retirement has always been an elusive goal for most Americans.

Despite what you often hear about the demise of defined benefit plans, the fact is that even in their hey-day in the 1970's, less than 50% of American private sector workers were covered by a retirement plan.

Nevin Adams of the Employee Benefit Research Institute calls out other retirement myths and reminds us that the "good old days" were really not that good for retirees if you consider the facts.  Here are a few facts that dispel the "myths" and explains that the present 401(k) retirement system has a number of advantages over the pension system.


  • There are actually more private sector workers participating in a workplace retirement plan today than there were in 1979. A pension plan did you no good if your employer did not offer it.
  • Median job tenure has hovered around 5 years since the 1950's.  It actually is 5.4 today-slightly higher than the long-term average.  Short tenure and job hopping quickly kills the typical defined benefit plan for a worker. In fact, with the old cliff vesting rules in place before the early 1980's, you might have to work years before becoming eligible for any benefit.  For example, my father did not become vested until he worked 20 years with his employer.  If he left at 19 years, he was entitled to zilch.
  • Between 1987 and 2012, fewer than 1 in 5 private sector employees spent 25 years or more with one employer.  Therefore, few workers would have received a "full" pension under most pension calculation rules even if they were in place.

You will notice that all of the facts above cite private sector retirement arrangements. The fact remains that most public sector employees are still covered by a pension plan while less than 15% of private sector workers are.  However, public sector employees have their own worries heading into retirement. Will they collect all that they expect?  They won't in Detroit.  And I suspect there should be significant worries as well for public sector employees in Illinois and a few other states.

We can only hope that all those boomers aren't busted before it is over. 

My advice? Have a big number set aside before thinking about retiring. I have done a lot of financial modeling for retirement for various people and I think most people need investable assets of about 10 times their final income to be reasonably confident that their nest egg at age 65 is big enough to sustain them through their lifetime in retirement (assuming no pension but considering full social security). 

Those with lower incomes can get by with a little less as social security payments will replace more income.  Those with higher incomes may need a higher multiple as social security provides a smaller income replacement ratio. The same goes for your retirement age. If you retire before age 65 you will need more than 10x. The longer you defer retirement after age 65, the multiple needed gets progressively lower with each year of added work and pay.

Sunday, June 8, 2014

A Curmudgeon's Conundrum

I like words.  I guess that is why I write BeeLine.

I especially like words that seem to convey their meaning even when you may have never heard the word before.  In thinking about this, it seems that a lot of these words begin with "c".

Chaos.

Curmudgeon.

Canoodle.

Of course, this all might be in my imagination because the fact is that once we learn something we cannot unlearn it. It stays with us.  It is impossible to go back and look at something the same way we did before we learned it.

Therefore, I think chaos perfectly represents complete disorder and confusion because that is what I have learned.  A curmudgeon is that old guy (Andy Rooney?) who always seems to be annoyed about something and it always will be. The guy and girl at the end of the bar who are cuddling and kissing are canoodling. But did I really think that way before I added those words to my vocabulary/

Another similar word is conundrum. When I think of conundrum I think of something that is puzzling, confusing or even paradoxical.

With that in mind someone sent me the following email the other day with"Conundrum" in the subject line.  I don't know who the original author was of this piece but it does raise some interesting points to consider.

Here it is exactly as I received it.

A conundrum....very strange

The definition of the word Conundrum is: something that is puzzling or confusing.

Here are six Conundrums of socialism in the United States of America:

1. America is capitalist and greedy - yet half of the population is subsidized.

2. Half of the population is subsidized - yet they think they are victims.

3. They think they are victims - yet their representatives run the government.

4. Their representatives run the government - yet the poor keep getting poorer.

5. The poor keep getting poorer - yet they have things that people in other countries only dream about.

6. They have things that people in other countries only dream about - yet they want America to be more like those other countries.

Think about it! And that, my friends, pretty much sums up the USA in the 21st Century.

Makes you wonder who is doing the math.

These three, short sentences tell you a lot about the direction of our current government and cultural environment:

1. We are advised to NOT judge ALL Muslims by the actions of a few lunatics, but we are encouraged to judge ALL gun owners by the actions of a few lunatics. Funny how that works.

And here's another one worth considering...

2. Seems we constantly hear about how Social Security is going to run out of money. How come we never hear about welfare or food stamps running out of money? What's interesting is the first group "worked for" their money, but the second didn't. Think about it.....

and Last but not least,

3. Why are we cutting benefits for our veterans, no pay raises for our military and cutting our army to a level lower than before WWII, but we are not stopping the payments or benefits to illegal aliens.

Am I the only one missing something?

Add me to the list.  All of this is a conundrum to this curmudgeon as well.

What about you?


Wednesday, June 4, 2014

Screen Time

When my grandfather was growing up, when they talked about a screen they were talking about something to keep the flies out of the farmhouse.


When my father was growing up, the screen he talked about was the local movie theatre.


When I was growing up, it was the tv screen.


Today, we have so many screens it is hard to keep up with them.  TV's. Laptops and PC's. Smartphones. Tablets. Those window screens and big screens are also still around but you don't hear as much about them.

On the subject of screens, I came across this interesting chart at TweetSmarter that daily distribution of the amount of time (in minutes) that people in various countries in the world are interacting with those various screens.


A few fascinating facts for your fancy from the data in the chart.

  • People everywhere in the world are spending a lot of time looking at screens.  The average is between 7 and 8 hours per day.
  • Indonesians are spending around 9 hours a day in front of screens to lead the world. Italians are at the bottom but they are still logging over 5 hours a day with screens.
  • Americans are still watching more TV screens than anyone-an average of 147 minutes per day. On the other end of the spectrum, the Vietnamese are only in front of the TV for a little over an hour.
  • The Chinese are on the laptop or PC longer than anyone-161 minutes per day. Compare that to Kenyans who are only spending 65 minutes and the Japanese who are only spending 68 minutes per day in front of the computer screen.
  • You need to go to Africa to get the highest daily diet of smartphone usage. Nigerians are putting in 174 minutes and the Saudis are logging 169 minutes per day on the small screen.  The French are at the bottom of this category with only 79 minutes per day.
  • The tablet kings are in the Phillipines (115 minutes) and Indonesia (110 minutes). I was surprised that the Japanese are tapping on their tablets for a meager 15 minutes per day. 
How much time are you spending if front or your screens each day?

Sunday, June 1, 2014

How Much Older And Wiser Can We Be In Two Years?

How could the GOP take 63 House seats in 2010 in what clearly was a clear rejection of the Democrats who passed Obamacare only to see Obama win in 2012?

How did that happen? Did that much change in two years?

What can we expect in the mid-term elections this November?

This chart explains a lot of what is going on. It shows voter turnout by age segment since 1964. Go here if you want to view a larger version of the chart.


Credit:Powerline


First, it shows that the electorate has gotten increasingly older over time.  In 1964, even before the Baby Boomers became voter eligible, 51 million in the age 18-24 cohort cast ballots.  However, they were still outnumbered by those age 65 and over that were voting. 66 million seniors cast ballots in 1964.

In 2012, 70 million people age 65 and over cast ballots compared to 38 million between the ages of 18-24.  The clear trend over the last fifty years is that there are more seniors voting than ever before (the primary reason is that there are many more age 65 and older Americans than ever) and fewer young people voting.

Are you beginning to understand why it is so hard for any politician to think about proposing any changes to Social Security and Medicare?

The other thing that stands out to me in the chart is the significant volatility in voting patterns of young voters between mid-term and Presidential election years.  Only 45%-60% of young voters in a Presidential election year will typically bother to cast a ballot two years later. On the other hand, you can count on 85%-88% of those age 65 or older who voted in the Presidential election to be at the polls in the mid-terms.

Why did the Democrats get hammered at the voting booth in 2010?  Voter turnout for those aged 18-24 was less than 20 million (45%) compared to the 44 million who turned out in 2008.  At the same time, 59 million of those age 65+ who voted in 2008 showed up to vote in 2010 (a mere 9 million drop-87%).

Another way to look at it is that in 2010 there were 3 voters age 65 and over for every voter 18-24.  In 2012, there were only 1.5 older voters to every younger voter.  The older voter advantage was cut in half in the Obama election of 2012.

Those numbers made a huge difference between those two years.

Let's look at the numbers assuming 60% of the younger voters supported the Democrats in 2010 and Obama in 2012 (60% of voters age 24 and under in the 2012 exit poll stated they voted for Obama) and assume 56% of voters age 65 and older supported the GOP in 2010 and Romney in 2012 (that is the exit poll number for Romney in 2012).

Here are the vote totals in millions using those assumptions for these two age groups.

                             Democrats              GOP

18-24                        11.4                     7.6
65+                           26.0                    33.0

Total 2010                37.4                    40.6      GOP wins big            


18-24                        26.4                    17.6
65+                           29.9                    38.1

Total 2012                56.3                    55.7     Obama beats Romney


The GOP won big in 2010 because younger voters did not vote. Obama won in 2012 because 24 million more young voters turned out compared to only 9 million more senior voters turning out compared to what they did two years earlier. That larger turnout resulted in a net increase of 4 million votes (from a losing margin to a winning margin) for the Democrats from 2010 to 2012. How big was that? Obama beat Romney by 5 million total votes.

Why is all of this important in 2014?  It says to me that the 2014 mid-term elections are going to be determined by two major factors-turnout and Obamacare. Obamacare remains deeply unpopular among older voters (most polls shows 60% disapprove in the age 65+ cohort).  Looking at historical voting patterns this spells trouble for the Democrats unless they can energize younger voters to vote in 2014. Voters under the age of 30 are the only age group that has positive views towards Obamacare.

Right now I like the odds for the GOP in November if they keep talking about the ills of Obamacare. They need to ignore anyone in their own ranks who says that it is time to accept Obamacare as the law of land.

There may be truth to that from a policy perspective that repealing Obamacare is a dead horse but that is totally wrong from a political perspective.  The polls indicate that it still is a very powerful emotional issue with voters (especially those who are opposed) and it remains the one issue that will get people to turn out to vote.

And although it might make sense for Republicans to be looking for ways to "fix" or "amend" Obamacare from a policy perspective, that position has no legs politically.  People vote "yes" or "no", they don't vote to fix something when they are not sure what the fix is.

In addition, the VA Scandal has just provided yet another opportunity to talk about the problems inherent in government-run healthcare.  How long will it be until you are put on a wait list by some government bureaucrat?  That is a pretty powerful question to be asking older voters.

My advice to Republicans is simple. Obamacare is a gift horse, not a dead horse.  Don't spend time talking about fixing it, keep talking about getting rid of it. The numbers above don't lie.  The 2014 elections will be determined by the ratio of older voters to younger voters.  It is that simple.

Tuesday, May 27, 2014

Printing Money

On my first trip to Washington, DC over fifty years ago I visited many sites during a week-long trip ---the White House, the Capitol, the Lincoln Memorial, the Jefferson Memorial, the Smithsonian, Mount Vernon, Arlington Cemetery, Ford's Theatre.  However, my favorite tourist stop was the U.S. Bureau of Engraving and Printing.  The place where they print all that green stuff.

Credit:Zimbio.com

It was dazzling for a 12-year old to see those big sheets of dollars go through the printing press and then see those sheets stacked high on palettes.  You could literally smell the money.


Credit: Marvin Joseph, Washington Post

I subsequently took my own children to see the money printing presses running and stopped by on my own a few years back when I had several free hours to kill while I was in D.C.  It still is an amazing place to visit.

You might ask why am I reminiscing about the Bureau of Engraving and Printing and my childhood travels when there is so much I could write about on this fine day?

It was this chart that I saw today while reading Grant Williams' newsletter, "Things That Make You Go Hmmm..."  which shows exactly how much currency printing the Bureau of Engraving and Printing has been doing lately. I thought all the "money printing" that we hear about was just limited to some computer entries at the Federal Reserve?  How do you reverse this?


As of 2012 there were approximately $300 billion in one hundred dollar bills in circulation.  That is a five-fold increase in 10 years.  It is also about ten times the total value of $20 bills in circulation.  If you do the math that also means that there are about twice as many $100's in circulation as there are $20's. 

In fact, it is estimated that over 75% of total U.S. currency in circulation today is denominated in those Ben Franklin's.


And to think that I rarely carry anything larger than a $20 bill on me because I think someone may not want to break it.  Where are all those hundred-dollar bills if you never see them?  It turns out that a significant number of them are residing overseas. Matt Phillips at the Quartz.com explains why the $100 greenback is so popular in foreign lands.

The cognoscenti look at the share of $100 bills as something of a proxy for foreign demand for US currency. An overwhelming majority of the $100 bills come from the Federal Reserve Cash Office in New York City, which handles the bulk of foreign shipments of US currency. A typical shipment is a pallet containing 640,000 such bills, or $64 million, according to a recent Fed paper.
And while there are plenty of reasons folks outside the US might want to hold dollars, the thinking is that most people are not using these $100 bills to buy milk and bananas. No, most economists seem to believe $100 bills are most often used as stores of value—almost something like mini-Treasury bills that don’t pay any interest. This is especially so in developing countries, where problems with unstable currencies and inflation often mean the purchasing power of local currency gradually—or not so gradually—erodes over time.
Of course, hundred dollar bills are also nice to have around if you might be dealing in illegal activities such as drugs, prostitution and the like. Those smaller bills can take up a lot of space and weigh you down if you need to start running.  Who wants some wise guy handing over a wad of singles?

To give you some context on just how fast the Bureau of Engraving and Printing has been turning out hundred dollar bills consider the following chart.  More hundred dollar bills were printed between 2010 and 2012 (the most recent data available) than were one dollar bills.  I am speaking of the actual notes, not the currency value.  That means that the currency in circulation over those three years denominated in $100 bills was up over 100 times compared to the $1 bills.


If you have not been overseas recently, done a drug deal, won big at a casino or work at the Bureau of Engraving and Printing, you might not have seen the new, redesigned $100 bill that debuted last Fall.  I have not seen it which tells you something about the life that I live.  However, I found this infographic on Google Images that shows the new look. If you come across one, send it my way.  BeeLine always needs (and accepts) cash.


Monday, May 26, 2014

Memorial Day 2014

I have featured Angela Pan's photography in BeeLine previously. Angela is based in Washington, D.C. and some of her best work features the the monuments and memorials in our capital city. Featuring her photographs has become a BeeLine tradition on Memorial Day.

These images truly honor the men and women who have given the ultimate sacrifice to preserve our freedom through the years.  May they never be forgotten.


Arlington National Cemetery
Angela Pan


World War II Memorial
Angela Pan 


Korean War Memorial
Angela Pan


Vietnam War Memorial
Angela Pan


Air Force Memorial
Angela Pan


Memorial Day began as a day of remembrance for those who perished in the Civil War.  Originally it was called "Decoration Day", a term I still remember my grandparents using to refer to this day of honor.  It originally was celebrated on May 30 of each year which I also remember. The holiday was established as the last Monday in May by an Act of Congress in 1971.

Lest we ever think about forgetting those who gave the ultimate sacrifice, these are the numbers of Americans who have laid their lives down for us per Wikipedia.

Civil War
625,000
WWII
405,399
WWI
116,516
Vietnam War
58,209
Korean War
36,516
Revolutionary War
25,000
War of 1812
20,000
Mexican-American War
13,283
War on Terror
  6,717
Phillipine-American War
  4,196


The flag this morning at my house.  The American flag should be flown at half staff until noon on Memorial Day per the United States Flag Code.  Full staff for the remainder of the day.

Thursday, May 22, 2014

A Loss of Appetite

For whatever reason I have been writing about food recently.  First, food stamps and then how the increased access to fast food has caused us to get both taller and wider as the years pass.

Today I came across another food story via the Viable Opposition blog that seems to tie my other two posts together pretty well.

It seems that back in 1980 the U.S. Department of Agriculture (USDA) put together a series of dietary recommendations for Americans age 2 and over in order to assist in maintaining a healthy weight as well as preventing the development of chronic diseases caused by poor diet.

Last year the federal government followed up to see how the American people were actually following the recommendations. I doubt you are going to be shocked at the result of those studies.

This is how Viable Opposition reported the story.

Economic Research Service (ERS) researchers, the body that provides research and economic information from the United States Department of Agriculture, undertook two studies that looked at how much consumers were spending on healthy choices and unhealthy choices as outlined above over the years from 1998 to 2006. Households recorded their food and beverage purchases of over 60,000 different products into the 23 USDA food plan categories with the beverage group consisting of all soft drinks and fruit drinks, the processed products which include dairy products, soups, frozen or refrigerated dinners and refined and whole grains and fresh or minimally processed products like frozen beans and canned tomatoes.
Now for the graphic showing the results of average at-home household spending on each of the 23 food categories (in blue) compared to the USDA recommended level of spending (in yellow).


In looking at the results we can see that U.S. households are doing the exact opposite of what the USDA recommended in almost every instance.

For example, the USDA recommends that about 40% of household food plan spending should go for vegetables, legumes and whole fruits.  Actual spending on these items is less than 10%.

The USDA recommends spending about 3% of the monthly budget on beverages, frozen entrees, sugar, candies and soup.  Actual spending on these items is over 1/3 of the typical household food budget.

You can see the effects of the increased accessibility and availability of food by the tremendous increase in the amount of calories consumed through fast food. In the late 1970's fast food only accounted for 3% of the calories of the American diet.  That number has increased over 4-fold since that time.


You might look at this and think that money has something to do with these choices.  After all, fresh fruits and vegetables are more expensive than a lot of the junk food.  However, the studies found no real differences in the mix of household food spending across income levels.

What remains difficult to understand is on the one hand you have the federal government providing recommendations for what people should have in their diets to maintain a healthy weight and avoid long-term chronic diseases.  However, on the other hand, they are handing out taxpayer money to almost 50 million people on food stamps to purchase whatever they want with almost no restrictions.

Both sides of this are being managed and administered by the U.S. Department of Agriculture which tells us that trying to limit food stamp purchases to select categories of food would be complex to be workable.

However, if it was not workable how was the USDA able to figure out how to change the rules for what can be purchased by schools for the school lunch program as a result of "The Healthy Hunger-Free Kids Act" that was signed into law in 2010?

Consider this report from The Washington Times on the new school lunch rules.

The new standards are exhaustive, including calorie ranges for each age group, sodium limits, zero tolerance for trans fats, and specific ounce amounts for meats and grains. White bread will be mostly phased out beginning in 2014 because only “whole grain rich” items will be allowed.

The school lunch rules have also meant that many school districts have had to buy new silverware and cookware to meet the USDA requirements.

Lunchroom costs are also going up due to the need for “new spoons and ladles to match the new portion size requirements.” Thirty-one percent of SFAs nationwide said they needed additional kitchen equipment to comply with the new lunch requirements last school year.

What also made little sense was that the rules mandated that school lunch prices had to be increased with the result that kids who pay full price for school meals actually declined by 10% due to additional federal subsidies that were given.  Only 30% of students today pay the full price for their school lunches. Over 60% are receiving free lunches and the remainder get partial subsidies.

That sounds a lot like Obamacare.  First raise the cost on everyone but then provide a subsidy so that there are that many more people who are dependent on the government's taxpayer's largesse.  Yet another example of the Redistribution of America right out of the Obama liberal playbook.


In Detroit, 78% of school children qualify for free lunches. Three years ago I wrote about the USDA pilot program there that allowed all of the students in the Detroit Public School System to receive free meals irrespective of income. That is a total of 66,000 students. What was the logic behind that?  The USDA says that it is giving rich kids free food so that the poor kids don't feel bad in getting the free food!

“We’ve worked very hard to reduce the stigma,” Aaron Lavallee, a U.S. Department of Agriculture spokesman, told the Detroit News. “We’re seeing a lot of working-class families who’ve had to turn to free school meals to feed their children.”

“Now all students will walk through a lunch line and not have to pay,” says Mark Schrupp, Detroit Public Schools COO. “Low-income students will not be easily identifiable and will be less likely to skip meals.”

It seems to me that the only people with hurt feelings would have been the 1 in 5 parents who were paying for school lunches for their kids before they ended up with the free lunch.

I guess this also goes to show you that, despite what you have heard, there really is a free lunch!

I don't know about you but all of this is enough to make me lose my appetite.

Tuesday, May 20, 2014

Four Inches Taller and Wider

I was in an historic building recently and couldn't help but notice how small the elevator was. The design of elevators in the 1920's were clearly meant for humans that were much smaller than we are today.  From both horizontal and vertical perspectives.


We all know that we are getting heavier.  The average weight for males between the ages of 20-74 has increased from 166 lbs. to 191 lbs since 1960. The average weight gain for females has increased ffrom 140 lbs. to 164 lbs over the same period. The weights of children have also increased as detailed in this report from the Center for Disease Control. This data is over a decade old so these numbers might actually be "light" today. (Update: these are light. 2012 CDC data reports that average male weight is 196 lbs with women at 166 lbs. Men have average waist size of 39.7 inches and women 37.5 inches.)

Look at these group photos from the 30's, 40's and 50's. How many overweight people do you see? Compare those images to what you see on the street today and you can understand why those old elevators are a little crowded these days.

1930's

1940's


1950's

The CDC report also notes an increase in height of about an inch for both men and women since 1960. This is consistent with another study from the U.K. that found that average heights of males had increased by four inches in the last hundred years. In research using British military records, it was found that the average 20-year recruit had increased in height from 5'6" in World War I to 5'10" today. Similar increases in heights have been noted in other Western countries.

Tim Hatton of the University of Sussex poses the question in a Live Science op-ed, "Why Did Humans Grow Four Inches In 100 Years? It Wasn't Just Diet".

Hatton points out that this gain in height is unprecedented in recorded history where there are reliable records of average heights going back to the middle ages.

The most obvious answer for the increase in heights is better nutrition. However, this does not appear to be the sole answer.

The 20th century saw dramatic improvements in diet. The quantity of food intake increased and its quality improved, as incomes rose faster than ever before. But in some countries economic historians have found that during the early stages of industrialisation average heights fell at the same time as incomeper capita increased. The most debated case is the US in the three decades before the civil war – this has become known as the “antebellum puzzle”. So income and height don’t always move in lockstep. But, as in earlier times, the correlation between trends in height and income is far from perfect.

The reduction in infections is cited by Hatton as another likely reason.

Something else is at work: exposure to infection. Repeated infection during infancy and childhood slows growth as nutrition intake declines or is used by the body to fight disease. Predominant among these illnesses are respiratory infections, notably pneumonia and bronchitis, and gastro-intestinal infections, especially diarrhoea and dysentery.
The key factor here is the urban environment. Sanitary reforms improved the quality of water supply and the disposal and treatment of sewage. In urban districts horses disappeared from the streets and pigs from backyards. Equally important was the reduction in overcrowding and improvement in the quality of housing, as the slums were gradually cleared.
There is another factor that may be at play here that Hatton does not mention. I am not so sure that hard, physical labor by children on the farm is particularly helpful when children are in their growth years.  It may have some effect on their growth plates. And there were a lot of children doing a lot of work on farms 100, 75 and 50 years ago.

Family income and number of siblings also seem to be factors.  Children born to higher income families and those with fewer siblings are taller.  In other words, nurture may be a significant factor beyond just nature (DNA makeup) in height.
By tracing their families in the 1901 census we can also see the household circumstances of the servicemen when they were growing up. This reveals that those from middle class families were taller and those with more siblings were shorter. The latter reflects a trade-off between the quantity of children and their average quality in terms of health. This too was a source of height gain, as average family size fell from five in Victorian times to just two by the 1930s.
What about the weight gain? That is much easier. There is clearly much more food available. However, most importantly in my mind, it is much more accessible.  Fast food was not available on every corner nor were there many pre-packaged ready to eat meals when I was growing up fifty years ago.  I did not step foot into anything like a McDonalds until I was well into my teens. Eating simply used to take a lot more work in the past to plan it, prepare it and consume it.

However, our weight gain issues are not solely related to availability and accessibility but may also be a result of a calorie distribution problem within our bodies.  David Ludwig and Mark Friedman posit in the New York Times that it is not overeating and too many calories that is the problem but our calories are going to the wrong place in our bodies.

More of us than ever are obese, despite an incessant focus on calorie balance by the government, nutrition organizations and the food industry.
But what if we’ve confused cause and effect? What if it’s not overeating that causes us to get fat, but the process of getting fatter that causes us to overeat?
The more calories we lock away in fat tissue, the fewer there are circulating in the bloodstream to satisfy the body’s requirements. If we look at it this way, it’s a distribution problem: We have an abundance of calories, but they’re in the wrong place. As a result, the body needs to increase its intake. We get hungrier because we’re getting fatter.

Ludwig and Friedman's thesis is that highly refined and rapidly digestible amounts levels of carbohydrates enter the body and are converted to insulin which attaches to fat cells rather than entering the bloodstream to be used as energy. These calories are not burned to fuel the body but are locked in storage in the fat cells.  That means that there are not enough calories in the bloodstream to fuel the body and you remain hungry and eat even more.

They back this up with a recent research study in which young adults on various low fat and low carb diets consumed the same number of calories but different distributions of carbs, fats and protein. However, subjects burned about 325 more calories per day on the low carbohydrate than on the low fat diet — amounting to the energy expended in an hour of moderately intense physical activity.

This tracks my own experience. When I have cut back on soft drinks, candy, refined sugars, potatoes, pasta and breads I have noticed consistent weight loss.  I have also found that I am generally am not as hungry when I am limiting carbohydrates.  This is despite the fact that carbs have about half the calories per gram as fat does. Therefore, weight control and the fight against obesity may turn more on diet quality and distribution than caloric intake.

This is how Ludwig and Friedman sum it up.
People in the modern food environment seem to have greater control over what they eat than how much. With reduced consumption of refined grains, concentrated sugar and potato products and a few other sensible lifestyle choices, our internal body weight control system should be able to do the rest. Eventually, we could bring the body weight set point back to pre-epidemic levels. Addressing the underlying biological drive to overeat may make for a far more practical and effective solution to obesity than counting calories.
I don't know about you but I am happy to have the extra four inches.  After all, that alone allows me to eat more than my ancestors. You would think that it would be easy to maintain a respectable Body Mass Index (BMI) with those extra four inches of height to spread the weight around.  However, as we all know, it is not easy. 

Think about diet quality and distribution and don't just diet by tracking calories.  I believe Ludwig and Friedman and others who have looked at the effect of carbohydrates in your diet are on to something. It will interesting to see where further research leads us.

Sunday, May 18, 2014

Is Hillary Too Old To Win?

The comments that Karl Rove made last week about Hillary Clinton's health also brought to my mind the question of her age.

Hillary will be 69 years old if she is elected President of the United States in 2016.  Only Ronald Reagan was older when he took the oath of office as President.

Credit: National Journal


The average age of individuals who have taken the oath of office of President over the last 100 years has been 55.5 years.  Therefore, Hillary would be almost a decade and a half older than the average age if she were to win The White House.

More interesting, Democrat Presidents have historically tended to be younger than Republican Presidents over the last century.

The average age of Democrats is 51.8.  Republican Presidents have an average age over the last century of 59.  If Truman and Lyndon Johnson are excluded (both first became President after the death of their predecessor) the average age for Democrats first elected President drops to 49.3--almost a decade a younger than Republicans.

Consider the nominees for each party for President since 1972.

Year                    Democrat                                       Republican

1972                    McGovern (50)                                Nixon (56)

1976                    Carter  (52)                                       Ford (63)

1980                    Carter (56)                                        Reagan (69)

1984                    Mondale (56)                                    Reagan (73)

1988                    Dukakis  (55)                                    George H.W. Bush (64)

1992                    Clinton  (47)                                      George H.W. Bush (68)

1996                    Clinton  (51)                                       Dole (73)

2000                    Gore  (52)                                         George W. Bush (54)

2004                    Kerry (61)                                          George W. Bush (58)

2008                    Obama (47)                                        McCain (72)

2012                    Obama  (51)                                        Romney (65)


In all but one election since 1972 the Democrat candidate for President has been younger than the Republican nominee. The only exception was Kerry in 2004.  Kerry is also the only Democrat candidate who has been over the age of 60 in the last 40 years.

On the other hand, George W. Bush and Richard Nixon are the only Republican candidates who have been under the age of 60!

Why does there appear to be a bias for younger candidates with Democrat nominees for President while Republicans seem to prefer older candidates?

I believe it has to do with the fact that each party's supporters fundamentally view the world in two different ways.  Democrats see the world in much more theoretical and idealistic terms.  Republicans tend to be more practical and pragmatic in their outlook.

Democrats tend to favor the most idealistic of the candidates. They seem to be more easily smitten with the new and fresh face. Who is the knight in shining armor that is going to make everything right?

Republicans have a tendency to nominate the most practical choice.  Or the steadiest hand with the lowest downside.  Being the fresh face in a field of Republican hopefuls has historically been a risky proposition.   Republicans have not been prone to roll the dice with their candidates.  Democrats are more like riverboat gamblers when making their choice. Style seems to be more important than substance and ideology trumps experience.

These perspectives also seem to have an affect on the age of the candidate. Since Democrats in the primary process tend to favor new, fresh faces, younger candidates apparently have an edge. Republicans, on the other hand, are looking for the proven, practical choice.  That is usually someone with some gray hairs on their head.

Look at the record.  The Democrats nominated the young JFK over Hubert Humphrey and Lyndon Johnson in 1960.  LBJ was not seriously challenged in 1964 but Eugene McCarthy and Bobby Kennedy caused him to withdraw from the race in 1968. Humphrey got the nomination that year but he did it by relying on the party bosses.  He did not run in one primary.

The Democrats came back in 1972 with liberal, anti-war South Dakota Senator George McGovern. They then turned to a relatively unknown Georgia governor in 1976.  Carter survived a challenge by Teddy Kennedy in 1980 who arguably had the more established political resume.

The Democrats went against type in 1984 with former VP Mondale but not without becoming enamored with super-cool,young Senator Gary Hart. They came back with a big bet with long-shot Massachusetts Governor Michael Dukakis in 1988.

Bill Clinton, another young first time Presidential candidate from a small state, prevailed in 1992.  They went against type with Al Gore in 2000 but he was only opposed by one candidate that year, Bill Bradley.  They then started a love affair with Howard Dean before he imploded early in 2004 and John Kerry was able to fill the vacuum.  Of course, untested Barack Obama then upset Hillary Clinton in 2008.

The Republicans, on the other hand, always seem to be looking for the most practical candidate they can find.  Nixon in 1960. Barry Goldwater won the nomination over Nelson Rockefeller and Bill Scranton in 1964 that was against type.  However, that was a watershed year that marked the end of the influence of the East Coast moderates in the GOP.

Nixon was the nominee again in 1968 and 1972.  Ford held off the emerging conservative movement with Reagan in 1976.  However, it opened the door for Reagan to be the practical choice for the nomination in 1980.

Bush, another VP, gained the nomination in 1988 and held off challenger Pat Buchanan in 1992. Steady Bob Dole was the guy in 1996.  George W. Bush was a newcomer in 2000 but he had the advantage of his father's name and an organization that positioned him as the establishment favorite from the start. Of course, John McCain prevailed in 2008 against newcomers Romney and Huckabee. That then set the stage for Mitt Romney to become the practical choice in 2012.

I am not saying that Hillary Clinton will not win the Democrat nomination in 2016.  She has enormous political advantages from both organizational and fund raising perspectives.  Her name identification is through the roof and the fact that she could become the first female President provides her with tremendous political appeal for the Democrat faithful. However, she did get beat by a younger, cooler, African-American male in 2008 in the Democratic primaries when she was eight years younger.  Who says it can't happen again with the right person?

More interesting is whether Hillary can win the general election at age 69 if she garners the Democratic nomination.  Especially if she is running against a Republican who is not in their 60's and has some charisma and some cool.

If Hillary is able to gain the nomination and be elected President of the United States as a Democrat as a woman at age 69 it will truly be historic on several levels.

Wednesday, May 14, 2014

One Place The Food Police Are Needed

Michelle Obama took on school lunches and Michael Bloomberg worked to outlaw large soft drinks in New York City.  A couple of prime examples of the food police.

However, the number of people on food stamps has skyrocketed over the past five years and there seems to be no interest in policing that food.

An average of 47.6 million people received food stamps each month during 2013.  That compares to 26 million when President Obama took office just over five years ago.

What is amazing is that there are now more people on food stamps than the number of women working full-time, year-round jobs.


Credit: ItMakesSenseBlog.com

To put that 47.6 million in further context, consider the fact that Barack Obama only had 62.6 million votes cast for him in the 2012 election.  Therefore, if every food stamp recipient voted for Obama that alone would be 76% of his total vote tally by itself.

The food stamp program was originally designed to help those who were dealing with economic hardship to have the opportunity to purchase a "low-cost, nutritionally adequate diet".

Note the key words there. "Low cost and nutritionally adequate".

With that background I read with some distress the following report on the food stamp program (officially known as the Supplemental Nutrition Assistance Program "SNAP") by the Malbeck Data Institute that found that 89% of food stamp purchases were for "unhealthy, overpriced convenience store junk food". Only 11% of welfare recipients were using their food stamps for basic ingredients for healthy meals.

I could not find any evidence of the Malbeck Data Institute in a Google search or the actual study. Therefore, I would question the source and the validity of the data.  However, even if the report is nothing but an urban myth there is little question that the food stamp program is in need of fundamental reform.

In the name of a low-cost, nutritionally adequate diet how come the taxpayers end up paying for Twinkies, Twizzlers, Cheetos and Mountain Dew?

We are not talking about an insignificant sum of money.  The food stamp program is now costing in excess of $80 billion per year.  That ought to feed a lot of hungry people. For context, that is more money than is collected in income tax on all 43 million tax returns with adjusted gross incomes of less than $50,000.

Decades ago, William F. Buckley wrote a piece in which he suggested that we could make sure no one in this country went hungry by providing four basic food items for free to anyone who wanted them. Skimmed milk, bulgur wheat, beans and lard would be stocked in bulk in every grocery store in America under his plan. He saw no sense in policing it once it was stocked figuring if someone took these items they really were hungry. No frills to be sure but it would get the job done with a fraction of the cost and bureaucracy of the food stamp program.

I am not suggesting anything so draconian but it seems that something is amiss. When someone can go into a grocery store and purchase caviar, crab legs and cashews with taxpayer money, and most of the taxpayers footing the bill would never think of buying these with their own money, we should be rethinking our approach. I have seen or been told stories of each of these purchases over the years as most of us have.

Any yet, nothing ever changes. More people get the stamps (replaced now with an EBT card) every year and the costs go up every year.


The U.S. Department of Agriculture, which administers SNAP, is adamantly opposed to placing any restrictions or limits on the current rules for food stamps.

For example, self-appointed soft drink policeman Mayor Michael Bloomberg asked the USDA three years ago to authorize a pilot program in New York City to exclude soft drinks from food stamp eligibility. At least, he was consistent in his food police activities. However, the USDA stated that the experiment would be "too large and complex" to implement and evaluate.

Bakery cakes, cookies and candy are all eligible purchases for food stamp recipients. In fact, most everything that is edible in a grocery store is eligible under the food stamp program except for hot, prepared meal items. Cigarettes and alcohol are excluded but someone can buy the caviar and crab legs and sell them for .50 on the dollar to someone else, take the cash and do anything they want with it (like buy their tobacco and beer). 

In Appalachia, selling black market pop purchased with EBT funds is a fundamental driver of the local economy according to this report by Kevin Williamson in National Review Online.

It works like this: Once a month, the debit-card accounts of those receiving what we still call food stamps are credited with a few hundred dollars — about $500 for a family of four, on average — which are immediately converted into a unit of exchange, in this case cases of soda. On the day when accounts are credited, local establishments accepting EBT cards — and all across the Big White Ghetto, “We Accept Food Stamps” is the new E pluribus unum – are swamped with locals using their public benefits to buy cases and cases — reports put the number at 30 to 40 cases for some buyers — of soda. Those cases of soda then either go on to another retailer, who buys them at 50 cents on the dollar, in effect laundering those $500 in monthly benefits into $250 in cash — a considerably worse rate than your typical organized-crime money launderer offers — or else they go into the local black-market economy, where they can be used as currency in such ventures as the dealing of unauthorized prescription painkillers — by “pillbillies,” as they are known at the sympathetic establishments in Florida that do so much business with Kentucky and West Virginia that the relevant interstate bus service is nicknamed the “OxyContin Express.” A woman who is intimately familiar with the local drug economy suggests that the exchange rate between sexual favors and cases of pop — some dealers will accept either — is about 1:1, meaning that the value of a woman in the local prescription-drug economy is about $12.99 at Walmart prices.

The USDA says that it is too complicated to try to segregate food items but the federal government requires that chain drug stores and pharmacies code what is eligible for FSA and HSA accounts in their inventory systems. 

Why can't we limit food stamps to low-cost, nutritionally adequate food items? Especially when the taxpayers are paying the bill?