One of the reasons that I like politics and write about it in BeeLine is that it comes with a lot of data.
Data is the lifeblood of what I write about. It provides objective truths which should be the foundation of the analysis of any issue.
In the political area, data is very valuable in getting a better understanding of what voters are thinking about in their lives, the issues surrounding them and their feelings about those who desire to lead them.
There is a lot of data to sift through in the election from Tuesday night. It will require a deep dive and additional time to really understand the details that drove the final results.
However, here are some data nuggets I have come across so far in my research that I have found interesting.
Election Turnout
Before the election I wrote that turnout would be very important in determining the final result. I also was very clear that I did not see evidence that Democrats would be able to come anywhere close to matching their 2020 turnout numbers.
There are more votes to be counted, particularly in states in the Far West, that are slow in reporting final results. We have been told that there are 5 million more votes to count in California and 1 million in Nevada.
However, consider the vote totals in the Presidential race compared to recent years thus far.
 |
| Source: https://www.ft.com/content/392e1e79-a8c1-4473-ab51-3267c415b078 |
One of the large groups that shifted to Trump in 2024 were younger voters.
Biden was +24 with younger voters but that shifted 13 points right in 2024.
The graphic below provides a better perspective of how the 18-29 vote has shifted, broken down between men and women, since 2018.
Notice that most of the shift in this demographic is due to young men rather than women moving to Trump in 2024.
However, young women have still shifted 15 points right and men 32 points right since 2018.
The other important point to consider with this data is that once a person becomes more conservative politically they do not often revert to prior voting patterns.
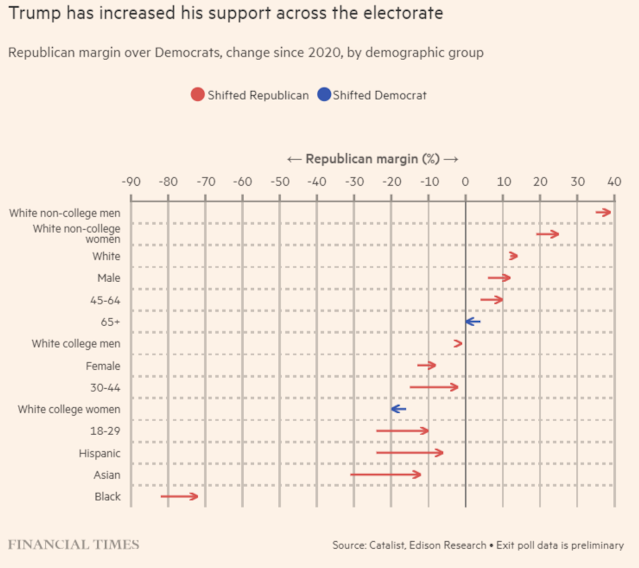
Here is another way to look at the overall demographic data across various groups.
Trump has the most support from non-college men and women. However, that changed very little between 2020 and 2024. The same was true for white voters.
The biggest gains were among Hispanics, Asians and younger voters (18-29 and 30-44).
Trump actually lost a small amount of support of voters age 65+.
You can also see big shifts in county level data between 2020 and 2024.
There were not many counties in the United States where Trump did not gain in 2024.
It was almost the exact opposite for him between 2016 and 2020 in key demographics.
 |
| Source: https://www.nytimes.com/interactive/2024/11/06/us/politics/presidential-election-2024-red-shift.html |
What I find most interesting in all of this data is that Trump has gained more support among Hispanics than any other group by far between 2016 and 2020.
This is despite the fact that he has been continually denigrated by the media and Democrats for his views on illegal immigration. He has been called racist, xenophobic and a lot worse
In fact, Trump actually won the nation's county (Starr County, Texas) with the highest percentage Hispanic population (98%) in the country. It is the first time that county has voted for a Republican since 1888.
 |
| Source: https://apnews.com/article/texas-election-border-house-trump-7b3c5adae15344dcb54f36e25890d1e2 |
It seems that legal immigrants who are citizens (and vote) have the same concerns about illegal immigration as everyone else.
Who knew?
Straddling the Fence
Many politicians like to straddle the fence on difficult issues hoping they will not turn off voters on one side or the other.
Exhibit A---Kamala Harris in this election.
Kamala was trying to says things that satisfied both Jewish voters and Arab voters.
It seems that she did nothing but hurt herself with both groups.
In precincts in and around Detroit, Harris lost 20% of former Biden voters to Trump while also losing 70% of Arab/Bangladeshi voters.
That is not easy to do.
If we focus just on Dearborn, Michigan, which is reputed to be be most Arab-American city in the United States, you see how disastrous straddling the fence was for Harris.
Her support in Dearborn was not even half of what Biden received in 2020.
No one should also forget the fence straddling that Kamala did on the eve of the election when she refused to say how she voted on California Proposition 36 which would have increased penalties for certain thefts and drug crimes in the state
Kamala was a strong advocate for lowering penalties for shoplifting less than $950 when she was the California Attorney General. It has proved disastrous in the state. This ballot issue was put to the voters to reverse the insanity.
How did the vote go?
Kamala Harris could not even take a position on this issue?
I guess she did not want to have to explain why she was for it before she was against it?
Compare this straddle with the clear position that Donald Trump took on illegal immigration from the first moment he ran for President.
At the Margin
This chart shows the shifts in state support for Trump in all 50 states and his plus or minus vote margin.
Vermont was the most pro-Harris state. Wyoming was the best Trump state in margin of victory.
 |
| Source: Financial Times |
 |
| Source: https://www.cnn.com/election/2024/results/minnesota |


As I stated in my response to the previous post, I was anxiously awaiting Beeline’s eloquent summary of the results. Lots of data to digest but one thing is clear. Americans are becoming exhausted with identity politics. As a Spanish sir-named male with a Master’s degree, I don’t like to be labeled. It’s then made worse by the pandering (or the opposite) from the Left. Trump spoke to ALL Americans. So many of your data points are the result of others feeling the same. To suggest for example that all Hispanics support an open border is ludicrous. As a native of Santa Fe but living in the DC area it’s clear to me that Trumps vastly improved performance in NM was a resounding defeat of open borders.
ReplyDelete